

説明
何を見ているか
これはウィックや終値から描画されているわけではありません。各バーごとに、ローリング5バーウィンドウを使用して実際のボリュームプロファイルを構築し、価格範囲を200のバケットに分割し、最も多くの取引量が実際に取引された場所を見つけます — それが基準となるレベルです。次に、その系列をスイングの高値と安値を探すために2つのルックバック速度でスキャンします:最近のピボット用の速いものと、より確立されたもの用の遅く広いものです。
読み方
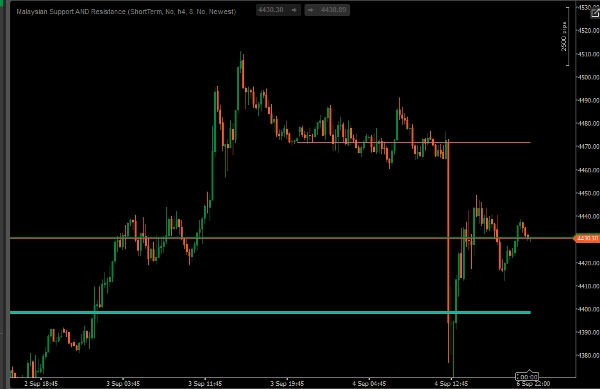
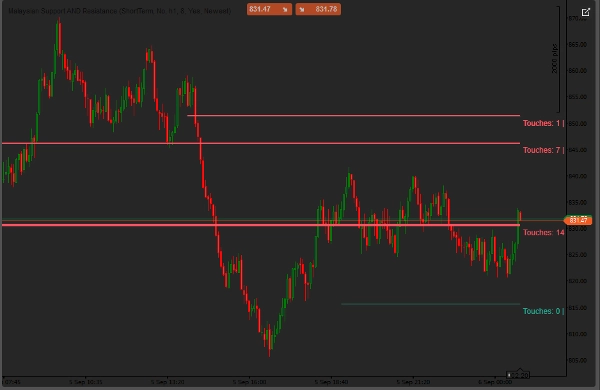
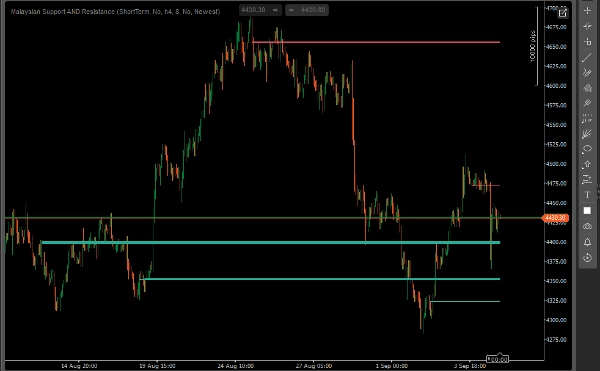
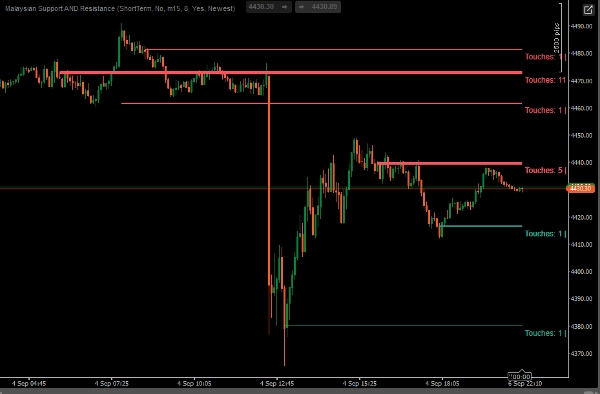
各ラインはサポートまたはレジスタンスレベルです。色は現在の価格がその上にあるか(サポート)、下にあるか(レジスタンス)を示します。太さはその重要度を示します — 価格が何回触れたか、そしてその近くでどれだけの取引量があったかです。「Show Touch | Volume Count」をオンにしてラインにカーソルを合わせると正確な数字が表示されます。一度に最大8つのレベルが表示されます:最新の速く形成された高値/安値、さらに3つのより確立された高値と3つのより確立された安値です。
主な設定
- マーケットビュー — 短期 / 標準 / 長期、ピボットを探す期間を制御します
- チャートの時間枠または特定のより高い時間枠を使用
- 表示するラインの数 — 1から8まで
- レベルの選択方法 — 最新(直近3つ)または最強(最も触れられた/最も取引量の多い3つ、年数に関係なく)
- Show Touch | Volume Count — 各ラインに数字を追加します
- サポート/レジスタンスの色 — 完全にカスタマイズ可能
対象者
価格アクション、SMC、またはICTスタイルのコンセプトで取引を行い、手動で描くのではなく客観的なサポート/レジスタンスを求めるトレーダー向けです。単独のシグナルとしてではなく、自分自身の構造や流動性の読みと組み合わせて使うことで最も効果的です。
知っておくべきこと
- レベルは十分なバーが経過して確認されるまで確定しません — 最近の価格は既に確認されたレベルを動かしません
- ボリュームはティックボリュームであり、FX/CFD/シンセティックに標準的なもので、取引所取引量ではありません
- ある程度の履歴を与えてください。新規上場または静かな銘柄では、最初は8つ未満のレベルしか表示されないことがありますが、ピボットが確認されるにつれて増えていきます
概要
AI summary
Malaysian Support AND Resistance is a trading indicator that identifies key support and resistance levels using a rolling volume profile. It analyzes every bar by constructing a volume profile over a rolling 5-bar window, dividing the price range into 200 buckets to locate price levels with the highest traded volume. The indicator detects swing highs and lows with two lookback speeds—fast for recent pivots and slower for more established levels.
Displayed lines represent support or resistance, with color indicating whether the current price is above (support) or below (resistance) the level. Line thickness reflects importance based on the frequency of price touches and volume traded near the level. Users can view up to eight levels simultaneously, including the newest fast-forming pivots and multiple established highs and lows. Additional features include customizable settings for market view (short to long term), timeframe selection, number of lines shown, level selection criteria (newest or strongest), and display of touch and volume counts.
This indicator is designed for traders employing price action, Smart Money Concepts (SMC), or ICT-style methods who prefer objective support and resistance levels derived from volume data rather than manual drawing. It functions best as a complementary tool alongside other structural and liquidity analyses. The volume data used is tick volume, standard for forex, CFDs, and synthetic instruments.
Displayed lines represent support or resistance, with color indicating whether the current price is above (support) or below (resistance) the level. Line thickness reflects importance based on the frequency of price touches and volume traded near the level. Users can view up to eight levels simultaneously, including the newest fast-forming pivots and multiple established highs and lows. Additional features include customizable settings for market view (short to long term), timeframe selection, number of lines shown, level selection criteria (newest or strongest), and display of touch and volume counts.
This indicator is designed for traders employing price action, Smart Money Concepts (SMC), or ICT-style methods who prefer objective support and resistance levels derived from volume data rather than manual drawing. It functions best as a complementary tool alongside other structural and liquidity analyses. The volume data used is tick volume, standard for forex, CFDs, and synthetic instruments.
インジケーターのプロフィール
インジケーターのカテゴリー
サポート&レジスタンス
出力の種類
ビジュアル表示
データ要件
取引高
ティックデータ
サポート対象のシグナル
ラインタッチ
カスタマーレビュー
0.0
レビュー: 0
カスタマーレビュー
この商品にはまだレビューがありません。お使いになったことがある方は、ぜひレビューをお願いします。
ディスカッション
よくあるご質問
Key Levels
Volume
Market Structure
Support & Resistance
cTrader Storeで入手可能な取引ボット、インジケーター、プラグインなどの商品は、第三者の開発者が提供するものであり、情報と技術の取得のみを目的としてご利用いただけます。cTrader Storeはブローカーではなく、投資助言や個人的な推奨を行うことも、将来のパフォーマンスを保証することもありません。
この作成者の他の商品


















価格
1
販売