

Descrizione
Previous HLOC – Livelli Smart a Timeframe Superiore per un Trading di Precisione
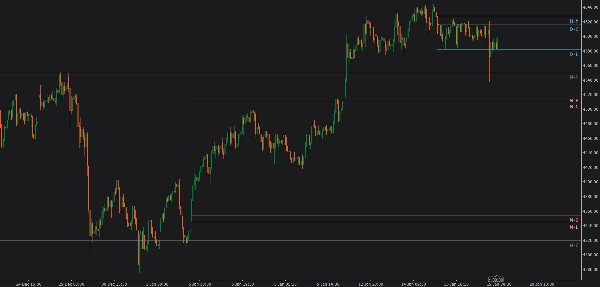
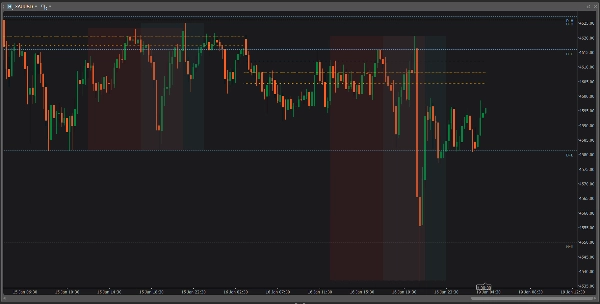
Previous HLOC è un indicatore professionale multi-timeframe che traccia i livelli di High, Low, Open e Close del periodo precedente direttamente sul tuo grafico con chiarezza e personalizzazione senza pari.
Progettato per trader price-action, scalper, trader intraday e swing trader, questo indicatore ti aiuta a identificare istantaneamente livelli istituzionali chiave che spesso fungono da supporto, resistenza, zone di rifiuto e obiettivi di liquidità.
Perché Previous HLOC?
I mercati reagiscono costantemente ai livelli del giorno, della settimana e del mese precedente. Istituzioni, algoritmi e trader professionisti monitorano attentamente questi livelli.
Previous HLOC porta quei prezzi critici sul tuo grafico in modo pulito e senza distrazioni—così non li perdi mai.
Caratteristiche Chiave
✅ Livelli Multi-Timeframe
- Scegli livelli della candela precedente Giornalieri, Settimanali, Mensili o Orari
- I livelli rimangono accurati indipendentemente dal timeframe del tuo grafico
✅ Controllo Completo di HLOC
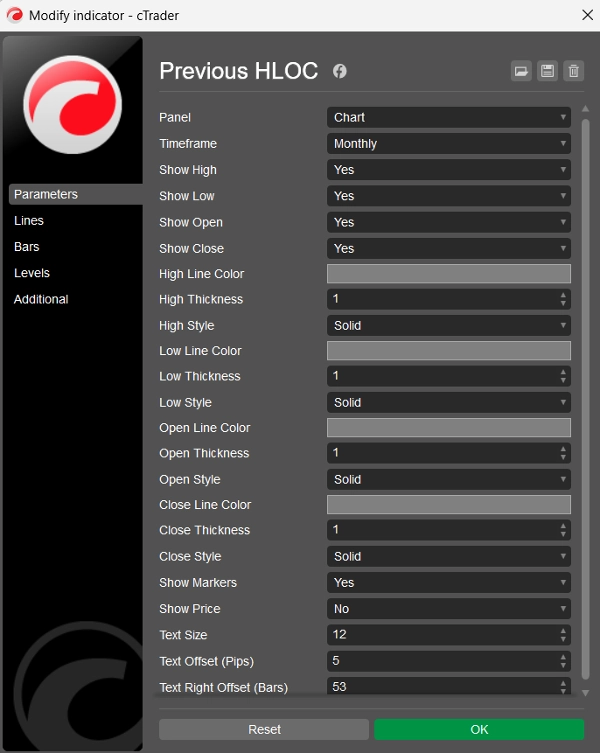
- Abilita o disabilita High, Low, Open, Close singolarmente
- Fai trading solo su ciò che conta per la tua strategia
✅ Personalizzazione Avanzata
- Colore, spessore e stile della linea separati per ogni livello
- Marcatori puliti in font Consolas con dimensione del testo regolabile
- Visualizzazione opzionale del prezzo accanto a ogni marcatore
✅ Marcatori Fluttuanti Intelligenti
- I marcatori si muovono naturalmente con il grafico
- Rimangono sempre allineati con il livello di prezzo durante lo scorrimento
- Posizionati sul lato destro per una chiara visibilità
✅ Livelli Proiettati nel Futuro
- Le linee si estendono molto nel futuro
- Ideale per pianificare ingressi, uscite, stop-loss e livelli di take-profit
🔹 Come Lo Usano i Trader
📌 Identifica forti supporti e resistenze intraday
📌 Usa High/Low precedenti come zone di sweep di liquidità
📌 Fai trading su breakout, rifiuti e retest
📌 Allinea gli ingressi con il bias a timeframe superiore
📌 Migliora la precisione rischio-rendimento
🔹 Per Chi È Questo Indicatore?
✔ Trader Forex
✔ Trader di indici e commodity
✔ Scalper e day trader
✔ Swing trader
✔ Trader price-action e SMC
🔹 Pulito. Veloce. Affidabile.
- Nessun repaint
- Nessun ritardo
- Nessun ingombro
- Funziona su tutti i simboli e tutti i timeframe
🔹 Sintesi
Previous HLOC non è solo un altro indicatore di livelli—è uno strumento professionale di trading che ti aiuta a fare trading con contesto, struttura e fiducia.
Se fai trading intorno ai livelli della sessione precedente, questo indicatore deve essere sul tuo grafico.
Riepilogo
Key features include advanced customization options such as separate color, thickness, and line style settings for each level, adjustable Consolas font markers with optional price display, and smart floating markers that stay aligned with price levels and positioned for clear visibility. The indicator extends these levels far into the future, aiding in planning entries, exits, stop-loss, and take-profit points.
Designed for price-action traders, scalpers, intraday, and swing traders, Previous HLOC helps identify key institutional levels that often act as support, resistance, rejection zones, and liquidity targets. It is applicable across various markets including Forex, indices, commodities, stocks, and cryptocurrencies.
The indicator operates without repainting or lag and works on all symbols and timeframes, providing a clean and reliable tool for trading with context, structure, and precision.
Discussioni
Recensioni dei clienti
5 | 100 % | |
4 | 0 % | |
3 | 0 % | |
2 | 0 % | |
1 | 0 % |

![Logo di "[Stellar Strategies] VBO"](https://cdn.ctrader.com/image/webp/f034c012-94d4-445a-a01b-febd1cdedaef_36944)















