
Deskripsi
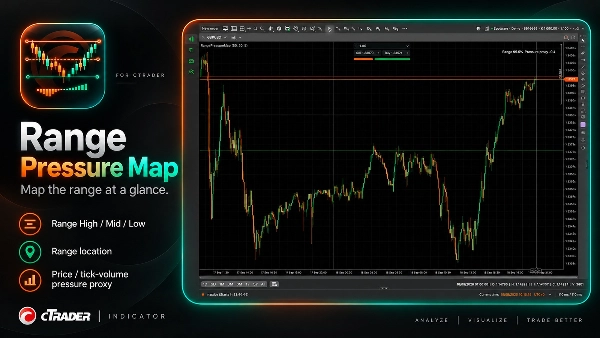
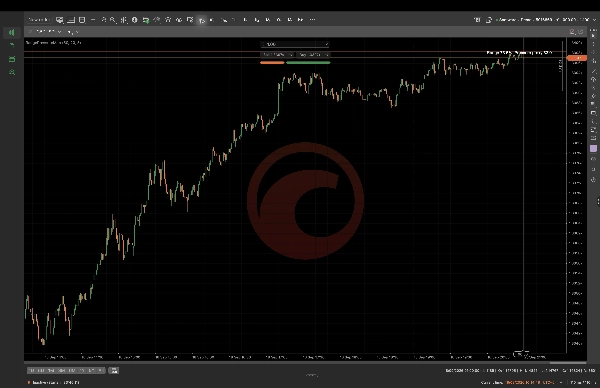
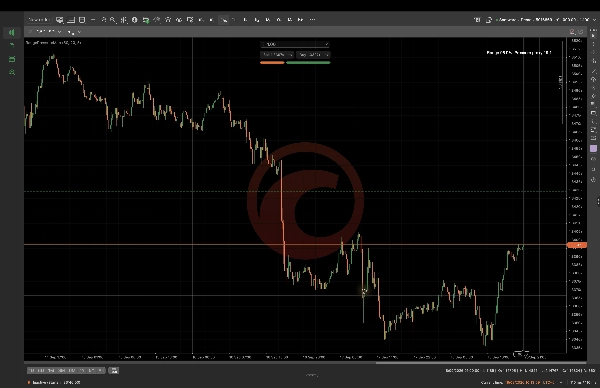
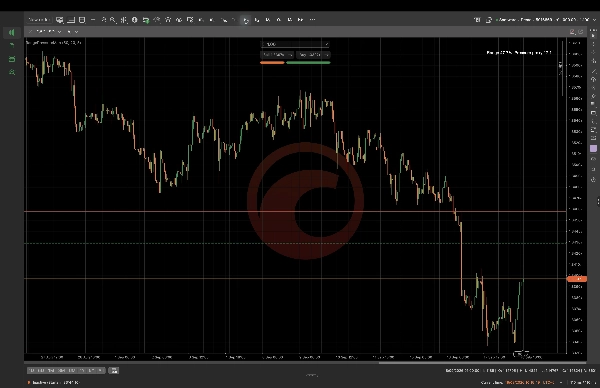
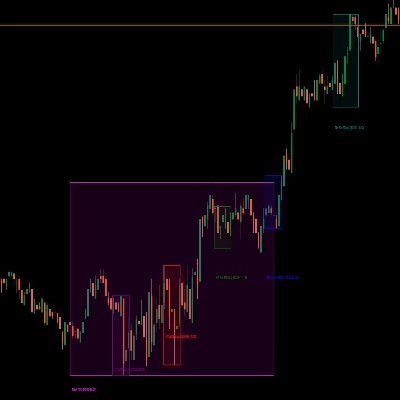
Peta Tekanan Rentang menghitung rentang tinjauan kembali dan menampilkan Rentang Tinggi, Rentang Tengah, dan Rentang Rendah bersama dengan lokasi harga saat ini dan proxy tekanan volume tick deterministik. Konfigurasikan tinjauan kembali rentang, tinjauan kembali tekanan, dan panjang EMA agar sesuai dengan konteks grafik yang Anda tinjau. Ini dirancang untuk analisis grafik diskresioner dan tidak mewakili aliran pesanan, volume pasar nyata, aktivitas pembeli atau penjual, prediksi, atau eksekusi perdagangan otomatis. Nilai bergantung pada simbol yang dipilih, kerangka waktu, parameter, dan data yang tersedia.
Ringkasan
Ringkasan AI
Range Pressure Map is a cTrader indicator that calculates a lookback range and visually displays the Range High, Range Mid, and Range Low levels on your chart. It also shows the current price location within this range alongside a deterministic tick-volume pressure proxy, which serves as an estimate of market pressure based on tick volume data. Users can customize parameters including range lookback period, pressure lookback, and EMA length to align with their specific chart context. This tool is intended for discretionary chart analysis and does not provide order flow data, real market volume, buyer or seller activity, predictive signals, or automated trade execution. Its outputs depend on the selected trading symbol, timeframe, and input parameters. The indicator supports visualization of support and resistance levels combined with volume-based pressure insights to assist traders in analyzing price action within defined ranges.
Profil indikator
Kategori indikator
Support & resistance
Tipe output
Visualisasi
Persyaratan data
Hanya batang
Diskusi
Ulasan pelanggan
5.0
Ulasan: 2
5 | 100 % | |
4 | 0 % | |
3 | 0 % | |
2 | 0 % | |
1 | 0 % |
Ulasan pelanggan
October 20, 2026
Range Pressure Map provided a clean and consistent range view on EURUSD and XAUUSD across H1 and M1. High, Mid and Low levels were clearly plotted, while the displayed range percentage matched the visible price location well. The pressure proxy added context without cluttering the chart or being presented as true order flow. Score 4,7/5
October 7, 2026
A range high, midpoint and low put the pressure proxy in a clear setting. Lookback and EMA controls make the view adjustable, and the description is upfront about using tick volume rather than real buyer and seller flow. That honesty makes the map easier to interpret.
Pertanyaan umum
EMA
Volume
Produk-produk yang tersedia melalui cTrader Store, termasuk bot trading, indikator, dan plugin, disediakan oleh pengembang pihak ketiga serta hanya ditujukan untuk akses teknis dan informasi. cTrader Store bukan broker dan tidak menyediakan saran investasi, rekomendasi pribadi, atau jaminan apa pun tentang kinerja di masa mendatang.











Harga
Sejak 16/09/2026