

Raf Volume Profile Pro v3.0
インジケーター
バージョン 1.0、Sep 2026
Windows、Mac
5.0
レビュー: 1
登録日 09/06/2026
4
販売
説明
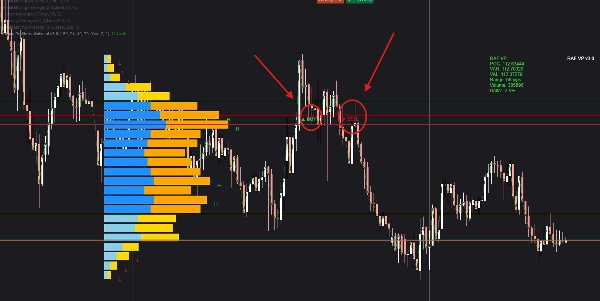
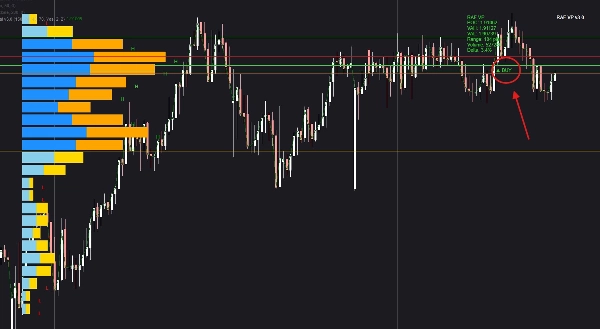
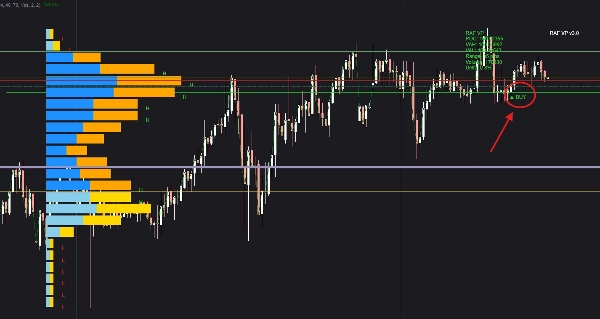
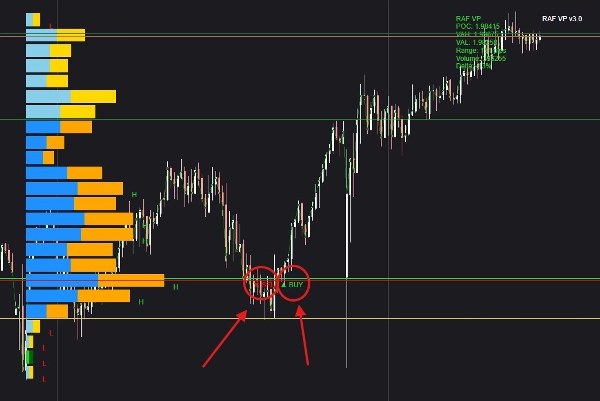
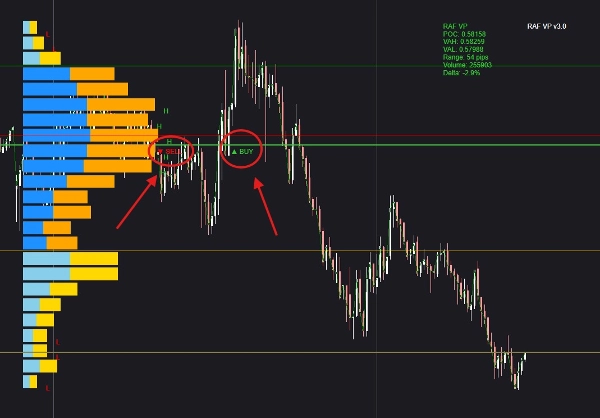
それは各キャンドルを分析して取引量が集中している場所をマッピングし、機関投資家が活動している実際のゾーンを明らかにします。ライブのボリュームプロファイルは、価格が停滞しやすいHVNエリアと、急速に突破できるLVNエリアを示します。デルタトラッキングは、各キャンドル内で買い手または売り手が勢いを増しているかを明らかにします。価格がPOC、不均衡ゾーン、または主要なボリュームシェルフと相互作用するとき、システムは注文フローの動きを評価し、市場支配の変化に基づいてBUYまたはSELLのシグナルを生成します。組み込みの情報ウィンドウはライブのPOC、デルタ、ボリュームレベル、およびシグナル条件を表示し、トレーダーがセットアップが形成されている理由とその強さを即座に確認できるようにします。これにより、標準的なインジケーターよりもはるかに高い精度で反転、継続セットアップ、および高確率のエントリーを特定するのに役立ちます。
概要
AI summary
Raf Volume Profile Pro v3.0 is an advanced volume-profile indicator designed to analyze each candle's trading volume distribution, highlighting zones of institutional activity. It identifies High Volume Nodes (HVN) where price tends to stall and Low Volume Nodes (LVN) where price can move rapidly. The tool tracks delta within candles to determine whether buyers or sellers are gaining strength. When price interacts with the Point of Control (POC), imbalance zones, or key volume shelves, the indicator assesses order flow and generates buy or sell signals based on shifts in market control. A built-in info window displays live POC, delta, volume levels, and signal conditions, providing real-time insight into the strength and formation of setups. This functionality supports identifying reversals, continuation patterns, and high-probability trade entries with greater precision than standard indicators. The product integrates concepts such as exponential moving averages (EMA), breaker blocks, key levels, imbalances, and support/resistance within its volume-based analysis framework. It outputs actionable signals including level touches, breaks, reversals, breakouts, and trend strength, relying on volume data as its primary input.
インジケーターのプロフィール
インジケーターのカテゴリー
取引高
出力の種類
シグナル
データ要件
取引高
サポート対象のシグナル
ラインタッチ
ラインブレイク
トレンドの強さ
ブレイクアウト
反転
カスタマーレビュー
5.0
レビュー: 1
5 | 100 % | |
4 | 0 % | |
3 | 0 % | |
2 | 0 % | |
1 | 0 % |
カスタマーレビュー
October 4, 2026
Raf Volume Profile Pro v3.0 provides clear volume histograms, POC and Value Area levels, Delta statistics, and BUY/SELL markers. Tested on EURUSD H1 and XAUUSD H1/M1, the indicator displayed consistently with a useful statistics panel. The layout is generally readable, although the profile can occupy part of the chart. A practical addition for discretionary volume analysis.
ディスカッション
よくあるご質問
EMA
Breaker Block
Key Levels
Imbalance
Volume
Support & Resistance
cTrader Storeで入手可能な取引ボット、インジケーター、プラグインなどの商品は、第三者の開発者が提供するものであり、情報と技術の取得のみを目的としてご利用いただけます。cTrader Storeはブローカーではなく、投資助言や個人的な推奨を行うことも、将来のパフォーマンスを保証することもありません。
この作成者の他の商品









価格
登録日 09/06/2026
4
販売