説明
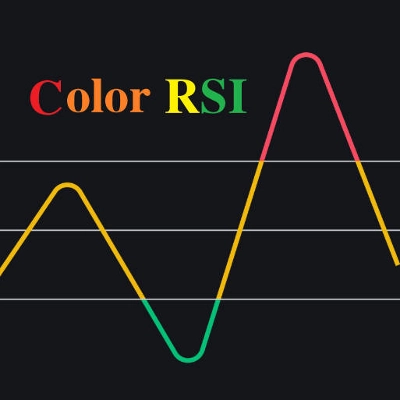
これはスーパーインジケーターです。RSIインジケーターと二重移動平均システムを統合しています。RSIの強度は4色で表されます:赤(>70) > オレンジ(>50) > 黄色(>30) > 緑。二重移動平均はデフォルトパラメータ48/144のEMAを使用し、ニーズに応じてカスタマイズ可能です。
使い方:
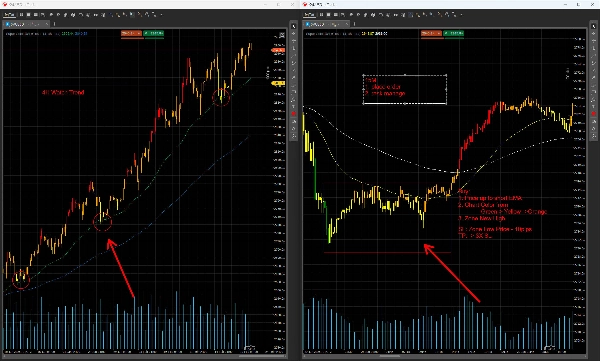
複数の時間軸(例:4H→15M、1H→5M、ここでは4H→15Mを例示)と組み合わせて使用する場合:
- 二重EMAによるトレンド識別(4Hタイムフレーム):
-
- 上昇トレンド:48EMA が 144EMAの上。
- 下降トレンド:48EMA が 144EMAの下。
- レンジ相場の統合:二つのEMAが絡み合っている状態。
- 15Mタイムフレームでのエントリー/エグジットポイント:
-
- 買いのセットアップ(上昇トレンド):
-
- 価格が4Hチャートの48EMAまで戻る。
- 15Mに切り替え:価格が15Mの統合レンジを上抜けた時にエントリー。
- ストップロス:直近のスイング高値に+10ピップスで設定。
- 売りのセットアップ(下降トレンド):
-
- 価格が4Hチャートの48EMAまで戻る。
- 15Mに切り替え:価格が15Mの統合レンジを下抜けた時にエントリー。
- ストップロス:直近のスイング安値に–10ピップスで設定。
- 価格のダイバージェンスシグナル:
-
- ベアリッシュダイバージェンス(トップ):
-
- 価格は新高値をつける(プルバック時)が、RSIの色が赤(RSI >70)からオレンジ(RSI >50)に変わる。
- ブルリッシュダイバージェンス(ボトム):
-
- 価格は新安値をつける(プルバック時)が、RSIの色が緑(RSI ≤30)から黄色(RSI ≤50)に変わる。
リスク警告:
すべての市場状況に適したインジケーターはありません。この戦略はライブ取引に適用する前にデモ環境で十分にテストしてください。不適切な使用は大きな損失を招く可能性があります。
概要
インジケーターのプロフィール
カスタマーレビュー
0.0
レビュー: 0
カスタマーレビュー
この商品にはまだレビューがありません。お使いになったことがある方は、ぜひレビューをお願いします。
ディスカッション
よくあるご質問
Prop
Forex
Indices
Commodities
RSI
Crypto
Stocks
cTrader Storeで入手可能な取引ボット、インジケーター、プラグインなどの商品は、第三者の開発者が提供するものであり、情報と技術の取得のみを目的としてご利用いただけます。cTrader Storeはブローカーではなく、投資助言や個人的な推奨を行うことも、将来のパフォーマンスを保証することもありません。
![「[Hamster-Coder] Moving Average MTF」ロゴ](https://cdn.ctrader.com/image/webp/b11b98b1-194d-4b8e-b00e-d611826ad159_31226)


価格
登録日 30/09/2024
44
販売