present
新規登録で初回購入時に$50オフ
Trading product for Dynamic swing levels reader インジケーター Fibonacci Fair Value Gap, image 1
Dynamic swing levels reader
インジケーター
1 ダウンロード数
バージョン 1.1、Nov 2026
Windows、Mac
Trading product for Dynamic swing levels reader インジケーター Fibonacci Fair Value Gap, image 2
1
無料インストール

説明

ダイナミックスイングレベルリーダー - Flex Renko Inverseのコンパニオン

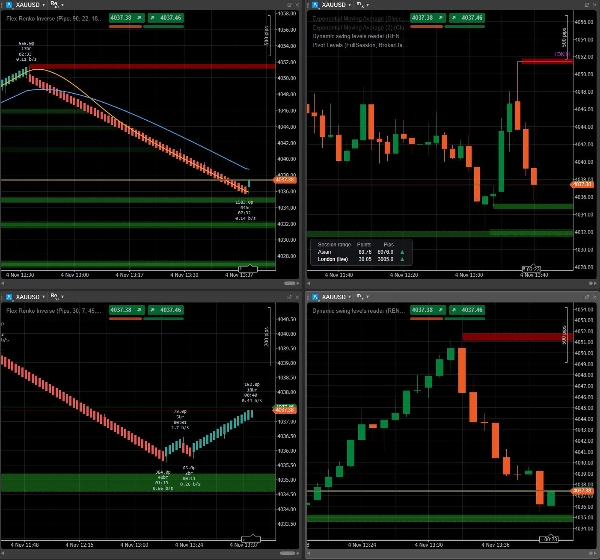
Flex Renkoチャートは、市場が実際にどこで反転したかを見つけるのに優れています。しかし、多くのトレーダーは依然として通常の時間足チャート(M1、M5、H1)で取引を行っています。ダイナミックスイングレベルリーダーはこの二つをつなぎます。Flex Renko Inverseチャートからスイングゾーンを取得し、同じシンボルの任意の時間足チャートにリアルタイムで描画します。


「Requires Flex Renko Inverse」の意味

このインジケーターは自分自身で何も計算しません。これはリーダーです。ゾーンは、当社のメインスタディであるFlex Renko Inverseによって作成されます。これはレンコブリックをティックごとに構築し、確認されたすべての反転をスイングゾーンとしてマークします。価格がまだ戻っていないゾーンが共有され、リーダーはまさにそれらを表示します。

Flex Renko Inverseがあなたのチャートのいずれかで動作していなければ、リーダーは表示するものがありません。だからこそ無料です:メインスタディを拡張するものであり、置き換えるものではありません。


使い方

  1. Flex Renko Inverseチャートを開き、「Instance name」に名前を付けます(例: RENKO_CONTEXT)
  2. 同じシンボルの任意の時間足チャートにダイナミックスイングレベルリーダーを追加し、「Read swing levels from」に同じ名前を入力します
  3. 以上です。ゾーンが表示され同期します。価格がゾーンに達すると両方のチャートから消え、レンコチャートが新しいゾーンを作成するとすぐに新しいゾーンが表示されます

両方のチャートは同じコンピューター上のcTraderで開いている必要があります。何かが接続されていない場合(名前が間違っている、シンボルが異なる、レンコチャートが閉じている)、インジケーターはチャート上で何が不足しているかを教えてくれます。


なぜFlex Renko Inverseを入手するのか

スイングゾーンはその機能の一つに過ぎません。Flex Renko Inverseは以下を提供します:

  • 実際のティックから構築されたレンコブリック。集計バーからではなく、トレンド継続と反転のための個別設定付き。クローズしたブリックは再描画されません
  • 強度付きスイングゾーン:転換点から始まった動きが大きいほど、そのゾーンがより目立ちます
  • 各スイングのサイズ、ブリック数、期間、速度を示すレッグラベル。現在のレッグが通常より速い場合は矢印付き
  • 1分、5分、15分、30分でスイングが広がっているか狭まっているか、どちらの側が支配しているかを示す回転ダッシュボード
  • 隠れたローソク足ではなく、ブリック上で計算された移動平均線
  • カーソル下の各ブリックのリアルタイム

遅いレンコをコンテキストとして使用し、そのゾーンを共有し、慣れ親しんだ時間足で取引してください。


👉 Flex Renko Inverseを入手: https://ctrader.com/products/5546

概要

AIによる概要
Dynamic Swing Levels Reader is an indicator designed to display swing level zones generated by the Flex Renko Inverse study on any timeframe chart within cTrader. It functions as a companion tool that reads and visualizes swing zones created by Flex Renko Inverse, which builds Renko bricks tick-by-tick and identifies confirmed reversals as swing zones. These zones are shared live and synchronized between the Flex Renko Inverse chart and any other chart of the same symbol, allowing traders to view Renko-based swing levels on their preferred timeframe charts (e.g., M1, M5, H1).

To use it, a Flex Renko Inverse chart must be open and named; the Dynamic Swing Levels Reader then references this name to display the corresponding swing zones. Zones disappear once price revisits them, and new zones appear as the Renko chart updates. Both charts must be open simultaneously on the same computer.

Flex Renko Inverse offers advanced features including real-tick Renko bricks with separate trend and reversal settings, swing zones weighted by move strength, detailed leg metrics (size, duration, speed), a multi-timeframe rotation dashboard, and moving averages calculated on bricks. This setup enables traders to use slower Renko charts for market context while executing trades on their usual timeframe charts.

インジケーターのプロフィール
インジケーターのカテゴリー
サポート&レジスタンス
出力の種類
ビジュアル表示
データ要件
バーのみ
外部データ
サポート対象のシグナル
クロス
ダイバージェンス
ブレイクアウト
反転
トレンドの強さ
ボラティリティ
ラインタッチ
ラインブレイク

ディスカッション

カスタマーレビュー

0.0
レビュー: 0
カスタマーレビュー
この商品にはまだレビューがありません。お使いになったことがある方は、ぜひレビューをお願いします。

よくあるご質問

Fibonacci
Fair Value Gap
Key Levels
Order Block
Market Structure
Supply & Demand
Support & Resistance
cTrader Storeで入手可能な取引ボット、インジケーター、プラグインなどの商品は、第三者の開発者が提供するものであり、情報と技術の取得のみを目的としてご利用いただけます。cTrader Storeはブローカーではなく、投資助言や個人的な推奨を行うことも、将来のパフォーマンスを保証することもありません。

この作成者の他の商品

インジケーター
Pin Bar
Order Block
+5
NEVER MISS A TREND & LET TRENDS RUN with Sierra Chart's Flex Renko Inverse, rebuilt for cTrader.
インジケーター
Fibonacci
Key Levels
+5
Draws RTH, Asian, London, prior day/week, ORB, Floor and Camarilla pivot levels as rays, with a session range table.

これも好きかも

インジケーター
RSI
MACD
+7
The ZigZag indicator is a technical analysis tool primarily used to identify key price reversal points.
インジケーター
SMC
Forex
+5
Detects Break of Structure (BOS) and Change of Character (CHOCH)
インジケーター
[Stellar Strategies] BOS Trend: Premium multi-timeframe BOS indicator for precision trend analysis.📈📉
インジケーター
RSI
MACD
+5
LudwigICT – Digital Root & IDR (cTrader Automate)
インジケーター
Detecting reversal zones + multidimensional mapping of support and resistance "Golden Levels.
インジケーター
SMC
Prop
+12
Multi-TF FVG + Smart Fibonacci
インジケーター
RSI
Fibonacci
+1
Spot RSI divergences on your chart and get an entry, stop and six targets when your filters line up.
インジケーター
BOS
EMA
+5
Market structure signals graded A to C, each with a drawn trade plan, plus an adaptive trend ribbon and a trend matrix
インジケーター
ATR
Forex
+11
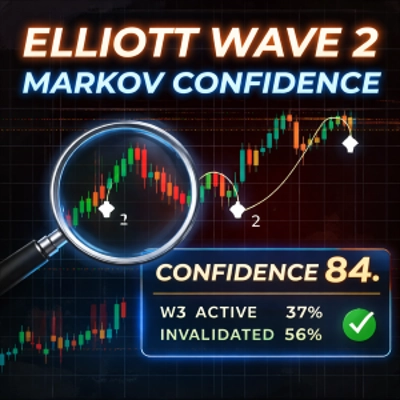
Elliott Wave 2 indicator with Markov probability analysis and a confidence score to assess Wave 3 continuation quality.
インジケーター
Breakout
Open Range Breakout by SLA is a fully customizable multi-session indicator designed for structured intraday traders.
インジケーター
Key Levels
Market Structure
+1
See the day's percentage targets from the open, so you know where the session stands at a glance.
インジケーター
Overview of the Fade Breakout Visualizer Indicator
インジケーター
ADX
ATR
+5
Multi-indicator confluence HUD & real-time backtest engine to detect trend alignment and filter high-probability setups.
インジケーター
Prop
Forex
+12
Introducing High Accuracy multi timeframe Swing high and low detector.
インジケーター
Key Levels
Support & Resistance
Add your provider's gamma levels by hand or automatically with our feed plugin, and see the gamma regime at a glance.
インジケーター
Prop
Forex
+11
⚡Nebula Range Filter is a professional trend filter indicator for cTrader⚡
インジケーター
VWAP
Volume
+1
Free session VWAP with value bands, session highs/lows, and tick-volume context for intraday traders.
インジケーター
Laser entries with pivot confirmation. No repaint, all timeframes. Professional results.

価格

1
無料インストール