
설명
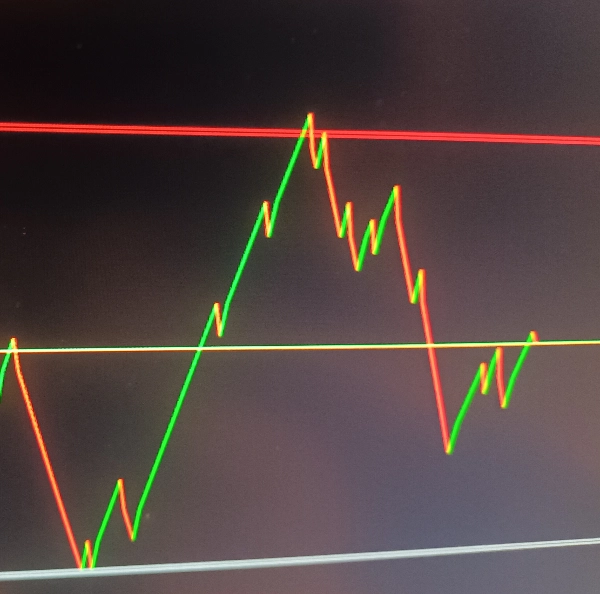
트렌드 비주얼:
가격 방향 변화에 따라 트렌드 라인(상승 추세는 녹색, 하락 추세는 빨간색)을 그립니다
차트에 노란색 가격선을 표시합니다
지지/저항 구역:
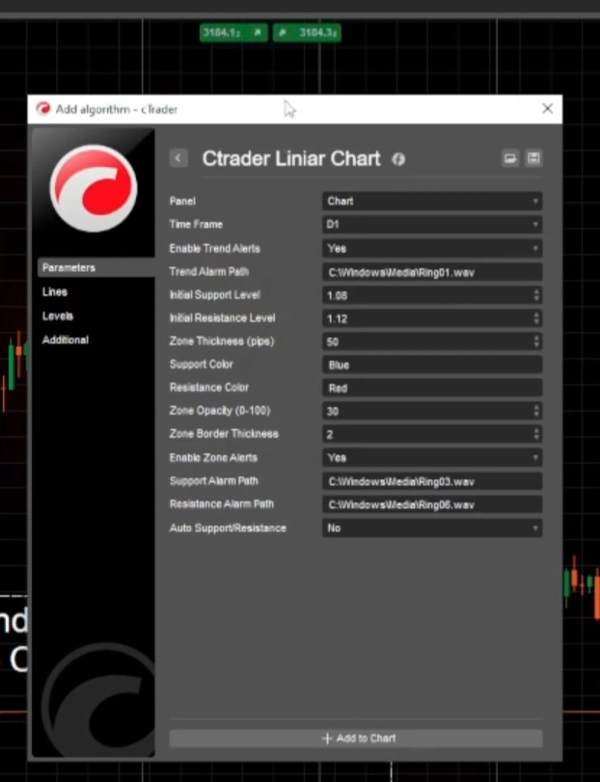
조정 가능한 두께(핍 단위)의 설정 가능한 지지 및 저항 레벨
구역에 대한 사용자 지정 색상 및 불투명도
차트에서 수동으로 조정할 수 있는 인터랙티브 구역
알림 시스템:
트렌드 변경 알림(가격 방향이 바뀔 때)
지지/저항 구역 도달 알림
다양한 이벤트에 대한 사용자 지정 사운드 알림
자동 지지/저항:
트렌드 변경 시 지지/저항 레벨을 자동으로 조정하는 옵션
작동 방식
선택한 시간 프레임 설정(기본값은 일간)
기본값 또는 사용자 정의 값으로 지지/저항 레벨 설정
구역 조정을 주기적으로 확인하기 위한 타이머 시작
계산 로직
각 바마다 현재 종가와 이전 종가를 비교
현재 트렌드 방향(상승/하락) 결정
현재 가격과 이전 가격 사이에 트렌드 라인 그리기
트렌드 방향이 바뀌면:
선택적으로 지지/저항 레벨을 자동으로 업데이트
트렌드 알림 트리거(활성화된 경우)
가격이 지지/저항 구역에 진입했는지 확인하고 알림을 트리거
구역 관리
지지/저항 구역은 반투명 사각형으로 표시
구역은 차트에서 수동으로 조정 가능하며 지표가 이를 추적
구역 두께는 핍 단위로 설정 가능
알림 유형
트렌드 알림: 가격 방향이 바뀔 때(상승/하락) 트리거
구역 알림: 가격이 지지/저항 구역에 진입할 때 트리거
자동 레벨 알림: 자동 지지/저항이 활성화되면 이 레벨이 자동으로 조정될 때 알림
시간 프레임 선택
다양한 알림 유형 활성화/비활성화
다양한 알림에 대한 사용자 지정 사운드 파일 경로
지지/저항 레벨.
요약
The indicator features configurable support and resistance zones displayed as semi-transparent rectangles, with adjustable thickness in pips, customizable colors, and opacity. These zones are interactive and can be manually adjusted on the chart, with the indicator tracking any changes.
An alert system notifies users of trend changes, price entries into support/resistance zones, and automatic adjustments of these levels if the auto-support/resistance feature is enabled. Alerts can be customized with different sound files and can be enabled or disabled individually.
The indicator periodically checks for zone adjustments and updates support/resistance levels automatically when trends change, if configured. It supports time frame selection and provides a comprehensive visual and alert-based approach to monitoring price trends and critical levels in trading charts.


