present
가입하고 첫 구매 시 $50 할인을 받으세요
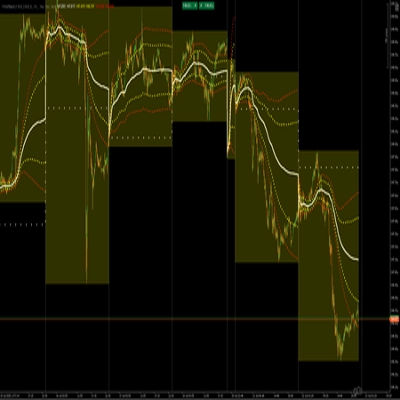
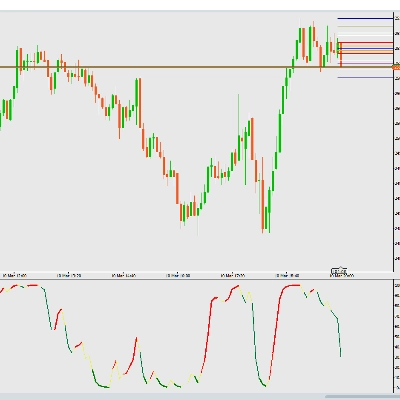
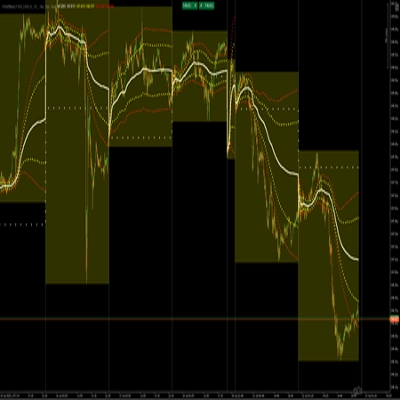
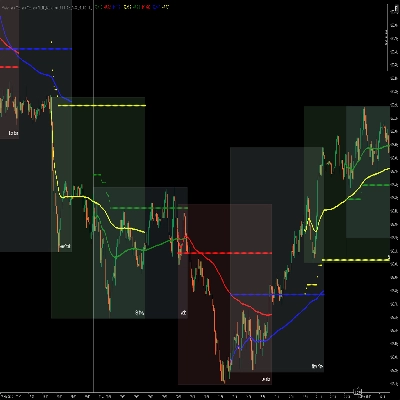
Trading product for VWAPBandDemoV2 지표, image 1
VWAPBandDemoV2
지표
10 다운로드
버전 1.0, Jul 2025
Windows, Mac
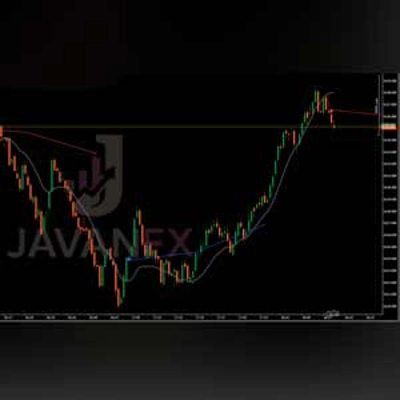
Trading product for VWAPBandDemoV2 지표, image 2
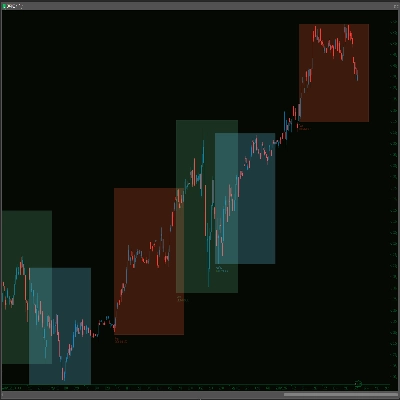
Trading product for VWAPBandDemoV2 지표, image 3
Trading product for VWAPBandDemoV2 지표, image 4
Trading product for VWAPBandDemoV2 지표, image 5
9
판매
16
무료 설치

설명

FX 세션 VWAP: 아시아, 런던, 뉴욕, 시드니 등 주요 FX 세션의 VWAP를 추적하여 각 시장 세션 동안 중요한 관심 수준을 식별하는 데 도움을 줍니다.

상위 타임프레임 VWAP: 상위 타임프레임을 세션으로 사용하여 일중 거래를 위한 추세 움직임을 포착하세요.

시장 세션 VWAP: 현재 시장 세션의 VWAP를 분석하여 최신 가격 움직임에 맞춰 거래할 수 있도록 합니다.

일간, 주간 및 월간 VWAP: 스캘퍼, 일중 거래자 또는 스윙 트레이더 등 거래 스타일에 맞게 일간, 주간 및 월간 VWAP 간을 원활하게 전환하세요.

사용자 정의 세션 VWAP: 맞춤 세션 시간을 설정하여 지표를 특정 요구에 맞게 조정하고 거래 일정에 완벽하게 맞출 수 있습니다.

FX 세션 VWAP 피벗: 세션별 VWAP 피벗으로 추가 명확성을 얻어 일중 거래 전략에 적합합니다.

3개의 사용자 정의 가능한 표준 편차 밴드: 선호하는 표준 편차 배수를 정의하여 강한 추세와 범위를 포착하세요.

For proudction version: https://ctrader.com/products/1501

요약

AI 요약
VWAPBandDemoV2 is a demonstration indicator that calculates the Volume Weighted Average Price (VWAP) with customizable standard deviation bands. It supports tracking VWAPs for major FX market sessions including Asia, London, New York, and Sydney, enabling identification of key price levels during these periods. The indicator allows analysis of VWAPs across multiple timeframes—daily, weekly, and monthly—catering to various trading styles such as scalping, day trading, and swing trading. Users can define custom session times to tailor the VWAP calculation to their specific trading schedules. Additional features include session-specific VWAP pivots for intraday strategy clarity and three adjustable standard deviation bands to help detect strong trends and ranging markets. This demo version is designed to showcase the functionality of VWAP with session and timeframe flexibility.
지표 프로필

상담

고객 리뷰

0.0
리뷰: 0
고객 리뷰
이 상품에 대한 리뷰가 아직 없습니다. 이미 사용해 보셨나요? 다른 사람들에게 가장 먼저 소개해 주세요!

자주 묻는 질문(FAQ)

트레이딩 봇, 지표, 플러그인 등 cTrader Store에서 제공되는 상품은 제3자 개발자에 의해 제공되며, 이는 단순히 정보 및 기술적 접근을 목적으로 제공된 것입니다. cTrader Store는 중개인이 아니며, 투자 조언, 개인별 추천 또는 향후 성과에 대한 어떠한 보장도 제공하지 않습니다.

이 작성자의 상품 더 보기
지표
Track VWAP for Asia, London, NY, Sydney, Daily, Weekly, Monthly & Custom Sessions. Perfect for FX & intraday trading!
지표
Ultra-Flexible VWAP Indicator with Advanced Customization

좋아하실 만한 다른 항목

지표
ATR
BOS
+3
Fair Value Gaps with Multi-Timeframe.
지표
Prop
Forex
+12
Lightweight Risk-Reward Visualization Tool.
지표
Forex
BTCUSD
+5
Cross EMA Pro – Trend Reversal Indicator
지표
Risk Dashboard
AI-powered daily range forecasts help traders spot volatility opportunities and plan stops and targets.
지표
ATR
BOS
+5
Opening ranges, dynamic trend channels, and multi-scale breakout/retest analysis for clear intraday chart decisions.
지표
MACD
Signal
Enhance your trading strategy with our customizable TradingViewMACD indicator. Optimize and elevate your market analysis
지표
Forex
BTCUSD
+11
Sero is a stochastic-based momentum oscillator that gives clear, color-coded visual signals for market momentum shifts.
지표
Conquer the markets with MA Sabres! This indicator spots trend flips with MAs and cool Sabre shapes & alerts.
지표
Forex
Crypto
Bar Close Alert Manager provides real-time alerts for bar closures with customizable notifications and automation.
지표
Forex
Version 3: Full control of session display including start and end times of all 3 sessions!
지표
Volume
Order Block
+3
Map market structure, order blocks, liquidity and key zones with an interactive cTrader dashboard.
지표
Volume
Key Levels
Free broker tick-volume profile context indicator with estimated POC, VAH/VAL, session/lookback modes, and clean visual
지표
ATR
BOS
+5
Market structure with BOS and CHoCH, order blocks, and retest buy/sell arrows with entry, stop and two targets
지표
Crypto
Signal
+3
Candlestick Signal Finder: cTrader indicator that automatically detects and color-codes key Japanese candlestick pattern
지표
Supertrend-based channel for entries, trailing stops, and dynamic support/resistance zones.
지표
Imbalance
Key Levels
+5
Smart Money Concepts (SMC) indicator with real-time Fair Value Gap (FVG) boxes, $50 round numbers, and live market HUD.
지표
RSI
VegaXLR's cTrader StochRSI identifies overbought/oversold RSI levels for precise trade entries.
지표
Signal
Cumulative Volume Delta tracks the net difference in tick volume between buying and selling pressure over time

가격

9
판매
16
무료 설치