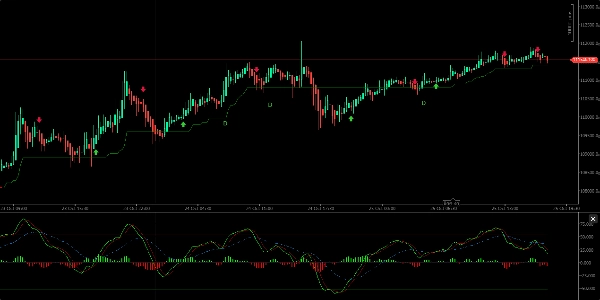
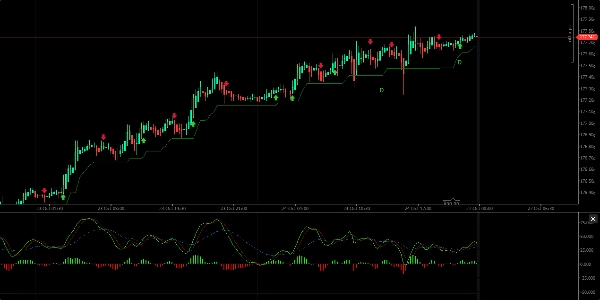
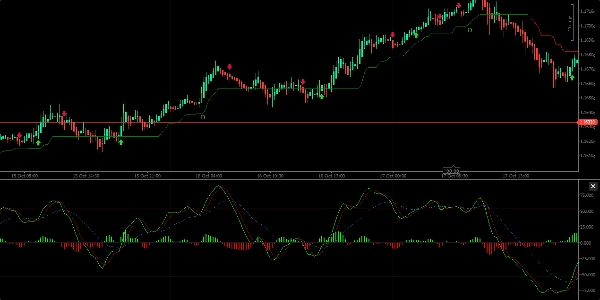
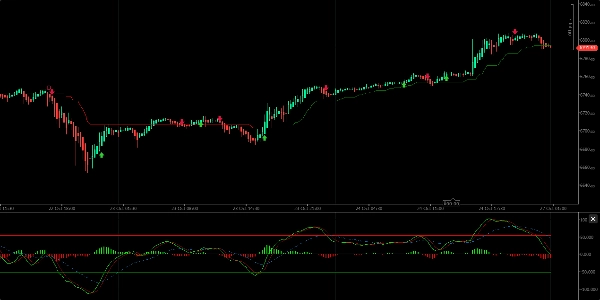
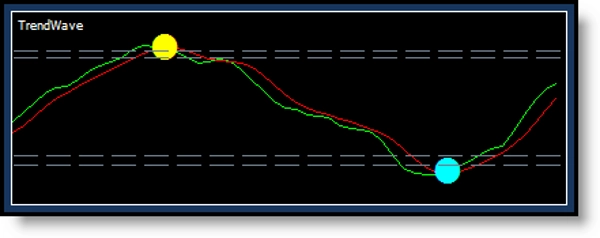
중개인 및 프랍
비즈니스용
00
Days
:
00
Hours
:
00
Minutes
:
00
Seconds
지표
ZigZag
NAS100
RSI
XAUUSD
ATR
Signal
Supertrend
EURUSD
MACD
GBPUSD
WAVETREND_withSourceCode
25/10/2025
Desktop
가입일 16/03/2025
무료 설치
256
"WAVETREND_withSourceCode" 업로드된 이미지"WAVETREND_withSourceCode" 업로드된 이미지"WAVETREND_withSourceCode" 업로드된 이미지"WAVETREND_withSourceCode" 업로드된 이미지"WAVETREND_withSourceCode" 업로드된 이미지

It provides buy-sell signals, trend direction indication, and identifies overbought and oversold zones. Visually, it comprises two value lines with a cloud/histogram in the center, which moves above and below a midline, representing rising or falling trends.

Key Features:

  • Buy signals occur when the green line crosses the red line upwards; sell signals when the green line crosses downward.
  • It shows trend direction with cloud waves above or below the midline.
  • The indicator displays green (buy) and red (sell) dots on crossing points, with corresponding candle color changes (yellow for buy, turquoise for sell).
  • Best used on 12-hour or 1-day intervals to avoid excessive short-term noise.
  • The indicator can identify divergences between price and momentum (regular bullish and bearish divergence), signaling potential price reversals.
  • It is advised to combine WaveTrend with other indicators like WMA, CMF, RSI, and MACD for more reliable trading decisions.

Overall, WaveTrend is a functional tool useful for identifying trend direction and trading signals but should be used alongside other analysis tools for confirmation.

0.0
리뷰: 0
고객 리뷰
이 상품에 대한 리뷰가 아직 없습니다. 이미 사용해 보셨나요? 다른 사람들에게 가장 먼저 소개해 주세요!
좋아하실 만한 다른 항목
지표
RSI
Breakout
XAUUSD
+4
Dynamic Market Structure Analysis of Turning Points
Identify market structure effortlessly with swing highs, lows, CHoCH, and BOS levels for smart trading decisions! 📊🔍"
지표
NAS100
Indices
XAUUSD
+6
JacksonZones
Maps intraday and multiday structure using Fibonacci-projected session ranges.
지표
NAS100
NZDUSD
Breakout
+13
AO_ZeroCross
Awesome Oscillator with instant zero-line cross alerts. Includes chart popup + sound notification
지표
Indices
XAUUSD
Forex
+4
Woodie_CCI
The Woodie CCI Indicator (Woodie Commodity Channel Index) is a variation of the classic CCI indicator
SupertrendHTF
Overlay higher-timeframe SuperTrend to filter noise, follow real trends, and avoid lower-timeframe whipsaws. As
지표
Stocks
Forex
Crypto
Quantum Weighted Moving Average (QWMA)
Quantum Weighted Moving Average (QWMA): an advanced moving average that dynamically adjusts weights to market movement
지표
NAS100
NZDUSD
Breakout
+18
Volatility Weighted Cloud by LudwigICT
Volatility-weighted cloud with adaptive bands and UP/DOWN tags for timing trends, pullbacks, and breakouts.
Pivot Point Super Trend
Laser entries with pivot confirmation. No repaint, all timeframes. Professional results.
지표
Forex
EURUSD
USDJPY
4 Currencies V2_NSC
Relative Currency Strength 4 Currencies: AUD USD EUR JPY
Donchian Flux Cloud
Trend-coloring Donchian cloud that highlights volatility squeezes and breakouts.
Cumulative Delta Candles + VolumeProfile
Cumulative delta candles + volume profile
Drawing Utility
A rectangular box with 5 adjustable Fibonacci level or even custom ones.
지표
NAS100
XAUUSD
Commodities
+11
SCOB
SCOB - Single Candle Order Block Indicator
지표
Grid
NAS100
NZDUSD
+15
RangeBoxFibonacci
With this Fibonacci retracement indicator, traders have full control over the retracement levels displayed on the chart.
지표
VWAP
FVG
Volume Profile Analytics
Volume distribution analysis with Market Profile TPO integration.
지표
Breakout
PDHL
PDHL - Previous Day High&Low
지표
NAS100
NZDUSD
Breakout
+15
Professional-grade Anchored VWAP
It calculates Anchored VWAP and StdDev bands from a user-defined start date for cTrader charts.
지표
Indices
Prop
Stocks
+3
Higher Timeframe Candlestick
Overlay a real-time higher-timeframe candle on your chart — color-coded bias without switching TFs.