🚀 ICT Breakers (BOS/MSS) - Meistere Marktstrukturveränderungen
Entdecken Sie professionelle Trading-Einblicke mit ICT Breakers, dem ultimativen Werkzeug zur Identifizierung kritischer Marktstrukturveränderungen. Basierend auf den Methoden des Institutional Composite Trader (ICT) erkennt dieser Indikator automatisch Break of Structure (BOS) und Market Structure Shift (MSS) Muster, die professionelle Trader zur Identifizierung von Trendfortsetzungen und Umkehrungen verwenden.
🔥 Hauptmerkmale
🎯 Intelligente Signalerkennung
- Break of Structure (BOS): Identifiziert Signale für Trendfortsetzungen
- Market Structure Shift (MSS): Erkennt potenzielle Trendwendepunkte
- Multi-Timeframe-Analyse: Höhere Zeitrahmenstruktur auf niedrigeren Zeitrahmendiagrammen
- Anpassbare Sensitivität: Passen Sie die Swing-Bar-Parameter für optimale Erkennung an
🎨 Professionelle Visualisierung
- Farbkodierte Signale: Verschiedene Farben für bullische/bärische BOS und MSS
- Anpassbare Stile: Wählen Sie zwischen durchgezogenen, gepunkteten oder gestrichelten Linien
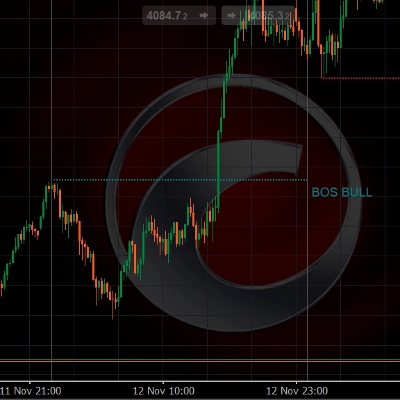
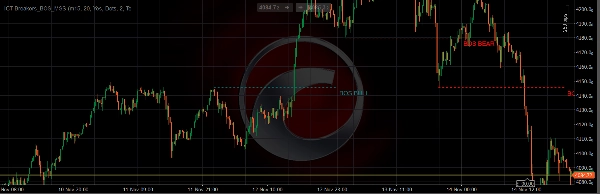
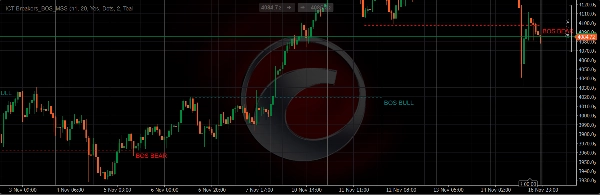
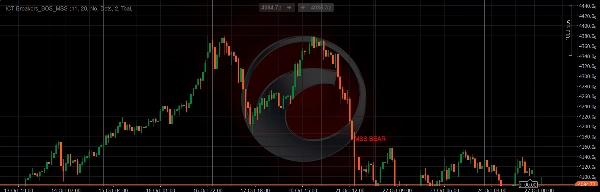
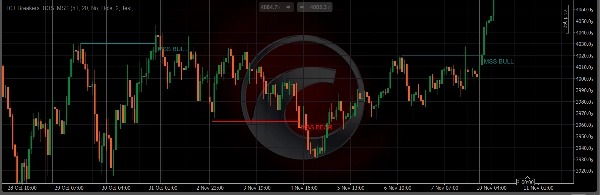
- Klare Beschriftungen: Jedes Signal ist mit "BOS BULL", "BOS BEAR", "MSS BULL" oder "MSS BEAR" gekennzeichnet
- Mehrere Anzeigeoptionen: BOS oder MSS unabhängig ein-/ausblenden
⚡ Erweiterte Konfiguration
- Körper-/Docht-Erkennung: Wählen Sie zwischen nur Körper oder Körper+Docht als Bruchkriterien
- Anpassbare Zeitrahmen: Analysieren Sie die Struktur aus jedem höheren Zeitrahmen
- Flexible Swing-Einstellungen: Passen Sie die Empfindlichkeit der Pivot-Punkte an
- Visuelle Anpassung: Volle Kontrolle über Farben, Linienarten und -breiten
🔔 Intelligentes Alarmsystem
- Visuelle Alarme: Textbenachrichtigungen im Chart
- Audio-Alarme: Optionale Tonbenachrichtigungen
- Nicht-Neuzeichnend: Signale bleiben nach ihrer Bildung konsistent
- Benutzerdefinierte Alarmnamen: Personalisieren Sie Alarmmeldungen
📈 So funktioniert es
ICT Breakers analysiert die Kursbewegung, um zu erkennen, wann die Marktstruktur bricht:
- BOS (Break of Structure): Tritt auf, wenn der Preis die vorherige Struktur in Trendrichtung durchbricht, was auf eine Fortsetzung hinweist
- MSS (Market Structure Shift): Passiert, wenn der Preis die Struktur gegen den Trend durchbricht und eine potenzielle Umkehr signalisiert
Der Indikator verwendet eine ausgeklügelte Pivot-Punkt-Erkennung über mehrere Zeitrahmen hinweg, um genaue und zeitnahe Signale zu liefern, die Ihnen helfen:
- Trendfortsetzungen frühzeitig zu erkennen
- Potenzielle Umkehrungen zu erkennen, bevor sie eintreten
- Mit institutionellem Marktstrukturverständnis zu handeln
- Falsche Signale durch Multi-Timeframe-Bestätigung zu reduzieren
🎯 Perfekt für
- Price-Action-Trader, die institutionelle Konzepte suchen
- Anhänger der ICT-Methodik
- Trader, die klare Strukturbruchsignale suchen
- Enthusiasten der Multi-Timeframe-Analyse
- Diejenigen, die eine automatisierte Marktstrukturüberwachung wünschen
⚙️ Einfache Einrichtung
- Fügen Sie den Indikator zum Chart hinzu
- Legen Sie Ihren bevorzugten höheren Zeitrahmen für die Strukturanalyse fest
- Passen Sie Farben und Stile an Ihren Trading-Stil an
- Aktivieren Sie Alarme für Echtzeitbenachrichtigungen
- Beginnen Sie mit professionellen Marktstruktureinblicken zu handeln
💡 Trading-Anwendungen
- Trendfolge: Verwenden Sie BOS-Signale, um Positionen im Trend einzugehen
- Umkehrhandel: MSS-Signale warnen vor potenziellen Trendwechseln
- Breakout-Bestätigung: Validieren Sie Breakout-Trades mit Strukturanalyse
- Marktkontext: Verstehen Sie die Gesamtmarktstruktur auf einen Blick
Es ist bis zum 31.12.2025 kostenlos, viel Spaß!!!