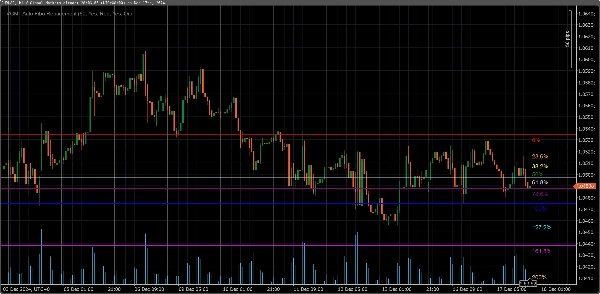
중개인 및 프랍
비즈니스용
00
Days
:
00
Hours
:
00
Minutes
:
00
Seconds
VGM - Auto Fibo Retracement
"VGM - Auto Fibo Retracement" 로고
가입일 17/12/2024
무료 설치
923
"VGM - Auto Fibo Retracement" 업로드된 이미지

This Auto Fibonacci Retracement Indicator automatically calculates and draws Fibonacci retracement levels on the chart based on the highest high and lowest low within a customizable lookback period. Users can configure colors and enable/disable specific Fibonacci levels, including popular extensions above 100% such as 127.2%, 161.8%, 200%, and 261.8%.

Key Features:
1. **Automatic Swing Detection**: Detects swing highs and lows dynamically within the chosen lookback period.
2. **Customizable Levels**: Enable/disable specific Fibonacci levels as per preference.
3. **Color Settings**: Choose individual colors for each level for better visual distinction.
4. **Extended Levels**: Includes commonly used extensions (127.2%, 161.8%, 200%, and 261.8%) for trend continuation analysis.
5. **Real-Time Updates**: Levels automatically adjust to changes in market conditions.

Ideal For:
- Traders using Fibonacci retracement and extensions for entry/exit levels.
- Users who need a clean, flexible, and automated Fibonacci tool.


Build by VantoFX. https://vantofx.com Free for all.

4.5
리뷰: 2
5
50 %
4
50 %
3
0 %
2
0 %
1
0 %
고객 리뷰
August 10, 2025
This is helpful my friend, thanks for the upload :)
July 9, 2025
Pros: Automatically detects swing points and plots Fibonacci retracement levels. Easy to use, customizable, works across timeframes. Cons: No tooltips or alerts. Lacks template saving and historical swing tracking. Requires additional confirmation tools for reliable trading.
좋아하실 만한 다른 항목
지표
NAS100
NZDUSD
XAUUSD
+10
[Stellar Strategies] Smart ADX
Master trends with Smart ADX: MTF Scanner, precise Buy/Sell signals, Divergence & clear Exit targets 🎯
DMI MONDAY ZONES v2.1
Marks Monday's OPEN,HIGH & LOW. These are areas of support and resistance for the week.
지표
NZDUSD
XAUUSD
Commodities
+3
AlgoCorner Correlations Map
Check the correlations between dozens of assets in one elegant display.
지표
Indices
Forex
Crypto
ICT Order Block
Order block
지표
NAS100
Indices
Prop
+3
session indicator
📈 Trading Sessions Indicator — London, New York & Tokyo Visualize Key Market Sessions + High/Low Levels with Precision
지표
Forex
EURUSD
USDJPY
4 Currencies V2_NSC
Relative Currency Strength 4 Currencies: AUD USD EUR JPY
지표
Forex
EURUSD
GBPUSD
AlgoCorner McGinley Dynamic
Designed to follow price more naturally, adjusting automatically to market speed, to reduce lag and false signals.
IR Coral
Coral indicator
Daily SD Levels - Indicator
Plots intraday VWAP and dynamic ±1/±2 standard deviation (SD) bands based on current day’s price and volume.
지표
Indices
RSI
XAUUSD
+8
MACARX 2026 ULTRA
🚀 MACARX Indicator - The Multi-Indicator Trend Fusion 🚀
지표
Indices
Breakout
Stocks
+2
VegaXLR - cTrader Pitchfork & Channel Enhancer
Enhance Pitchfork & Price Channels in cTrader with customizable Equidistant and Fibonacci levels.
지표
Grid
RSI
XAUUSD
+14
Trend Entropy pro
Entropy is the scientific measure of disorder or uncertainty in a system
지표
NAS100
NZDUSD
Breakout
+18
Free Smart Money Concepts (SMC) from TradingView
Free Smart Money Concepts from TradingView for cTrader: BOS/CHoCH, OB, FVG, liquidity, MTF levels, discount zones.
지표
ATR
Forex
Signal
+4
Follow Line
The Follow Line Indicator is a versatile tool designed to identify market trends and provide accurate buy/sell signals.
지표
Grid
NAS100
NZDUSD
+6
Volume Break Structure
🎯Identify zones of HIGH INSTITUTIONAL INTEREST: Where there is MORE VOLUME in the breaks, there is GREATER PARTICIPAT..
지표
NAS100
NZDUSD
XAUUSD
+12
WT - Amplitude - Momentum Detection
Experience a new approach with amplitude-based momentum analysis. Smart Trend Detection That Adapts to Market Volatility
Simple MACD Histogram
Simple MACD Histogram with color-coded rising (green) and falling (red) momentum bars.
Rsi buy Sell Signal
Instant‑setup RSI scalper—designed for turbulent markets.