설명
📊 Fib Volume Delta 지표 (무료)
cTrader용 피보나치, 프로젝션 및 실제 볼륨 델타
🆓 Fib Volume Delta 지표는 무료 전문 지표로서 cTrader를 사용하는 트레이더들이 피보나치 되돌림, 시장 구조, 그리고 실제 볼륨 델타를 깔끔하고 직관적으로 분석할 수 있도록 설계되었습니다.
이 지표는 Fib Volume Delta Bot의 기반으로, 동일한 논리를 수동적이고 시각적인 형태로 제공합니다.
📌 지표 사용법 (수동 분석용)
관련 도구 안내
이 지표는 동일한 피보나치 및 볼륨 델타 논리를 기반으로 한 자동 거래 솔루션인 Fib Volume Delta Bot의 분석적 기반입니다.지표는 수동 분석 및 의사결정 지원용으로 설계되었지만, cBot은 이 논리를 고급 위험 및 거래 관리가 포함된 완전 자동화 전략으로 전환합니다. https://ctrader.com/it/products//3006/?u=Labot
🔍 지표 기능
이 지표는 자동으로:
✅ 스윙 고점 및 저점
✅ 주요 피보나치 레벨
✅ 실제 볼륨 델타 (강세 vs 약세 틱 볼륨)
✅ 피보나치 프로젝션을 사용하여 잠재적 가격 목표를 예측합니다.
✅ 외환, 암호화폐, 지수에 적용됩니다.
재도색 없음.
시뮬레이션된 볼륨 없음.
불필요한 요소 없음.
🧮 주요 기능
📐 피보나치 구조
- 현재 가격 범위 자동 감지
- 동적으로 그려지는 피보나치 레벨:
-
- 23.6%
- 38.2%
- 50.0%
- 61.8%
- 78.6%
- 스윙 순서에 따른 강세 또는 약세 논리
🔮 피보나치 프로젝션
- 선택적 프로젝션 라인으로 미래 가격 목표 추정
- 동일한 스윙 범위 사용
- 이용 용도:
-
- 이익 실현 계획
- 위험/보상 평가
- 시나리오 분석
📊 실제 볼륨 델타
- 계산: 강세 vs 약세 틱 볼륨
- 표시:
-
- 강세 볼륨
- 약세 볼륨
- 델타 (강세 − 약세)
- 식별 도움:
-
- 흡수
- 발산
- 움직임 뒤의 강도 또는 약점
⚠️ 실제 틱 볼륨을 사용하며, 시뮬레이션 데이터가 아닙니다.
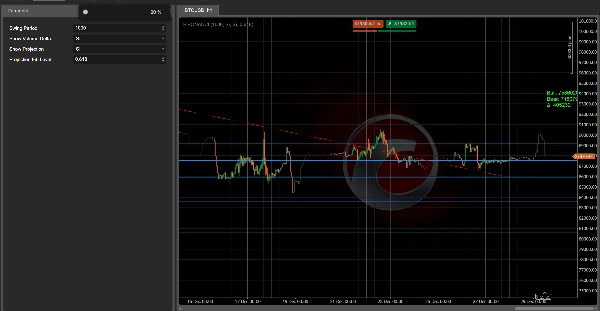
⚙️ 매개변수 설명
🧭 스윙 감지
- 🔢 스윙 기간
-
- 스윙 고점과 저점을 감지하는 데 사용되는 바 수
- 값이 높을수록 더 안정적인 구조
- 값이 낮을수록 더 반응적인 구조
📊 볼륨 델타
- 👁 볼륨 델타 표시
-
- 차트에서 볼륨 델타 텍스트를 활성화/비활성화
🔮 프로젝션
🧠 사용 방법
✔ 주요 되돌림 구간 식별
✔ 볼륨 델타로 진입 확인
✔ 현실적인 목표 예측
✔ 가격 행동 또는 추세 필터와 결합
✔ 수동 거래 또는 반자동 워크플로우에 적합
🤖 지표 + 봇 워크플로우
이 지표는 Fib Volume Delta Bot의 시각적 및 분석적 기반입니다:
- 📊 지표 → 분석 및 확인
- ⚙️ cBot → 실행, 위험 관리 및 자동화
다음과 같이 사용할 수 있습니다:
- 지표 단독 사용 (수동 거래)
- 또는 cBot과 함께 사용하여 완전 자동화
🆓 무료 및 투명
✔ 완전 무료
✔ 잠금 기능 없음
✔ 외부 의존성 없음
✔ 전문 트레이더를 위해 설계됨
⚠️ 면책 조항
이 지표는 스스로 신호를 생성하지 않습니다.
이는 의사결정 지원 도구로, 적절한 위험 관리와 시장 상황과 함께 사용되어야 합니다.
요약
Key features include dynamic Fibonacci level drawing based on current price ranges, real tick volume data (not simulated), and a clean, non-repainting interface. Users can customize swing detection sensitivity, toggle volume delta display, and enable or disable projection lines with selectable Fibonacci extension levels.
This indicator serves as the analytical foundation for the Fib Volume Delta Bot, an automated trading solution that applies the same logic for trade execution and risk management. It is intended as a decision-support tool to identify retracement zones, confirm entries with volume delta, and project realistic targets, suitable for manual or semi-automated trading workflows.