
Tracking Performance by Quantara
Wskaźnik
31 pobrania
Wersja 1.0, Feb 2026
Windows, Mac
Opis
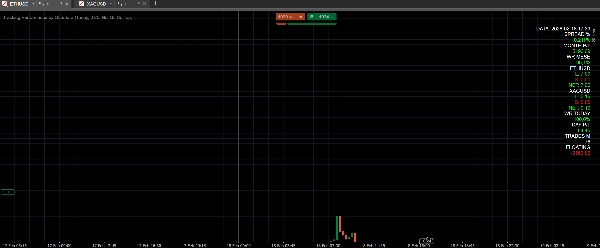
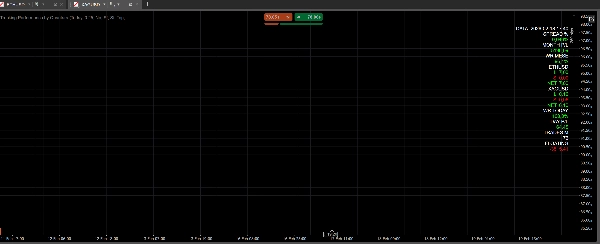
Tracking Perfromance by Quantara to wskaźnik na pulpicie wyświetlający metryki wydajności w czasie rzeczywistym oraz ekspozycję na poszczególne aktywa.
Pokazuje: miesięczny i dzienny P/L, miesięczną i dzienną skuteczność, miesięczną liczbę transakcji, pływający P/L, spread w procentach oraz long/short/net dla każdego otwartego aktywa.
Wszystkie wartości są kodowane kolorami dla szybkiego odczytu (pozytywny/negatywny P/L, progi skuteczności, long zielony, short czerwony).
Co oblicza/wyświetla
- Spread % (z różnymi progami dla metali i kryptowalut)
- Miesięczny i dzienny P/L
- Miesięczna i dzienna skuteczność
- Miesięczna liczba transakcji
- Pływający P/L
- Ekspozycja na poszczególne aktywa (long / short / net)
Zalecane instrumenty/ramy czasowe
- Działa na dowolnym instrumencie i dowolnej ramie czasowej
- Sugerowane na głównych wykresach (M15–H4) do codziennego monitoringu
Jak używać
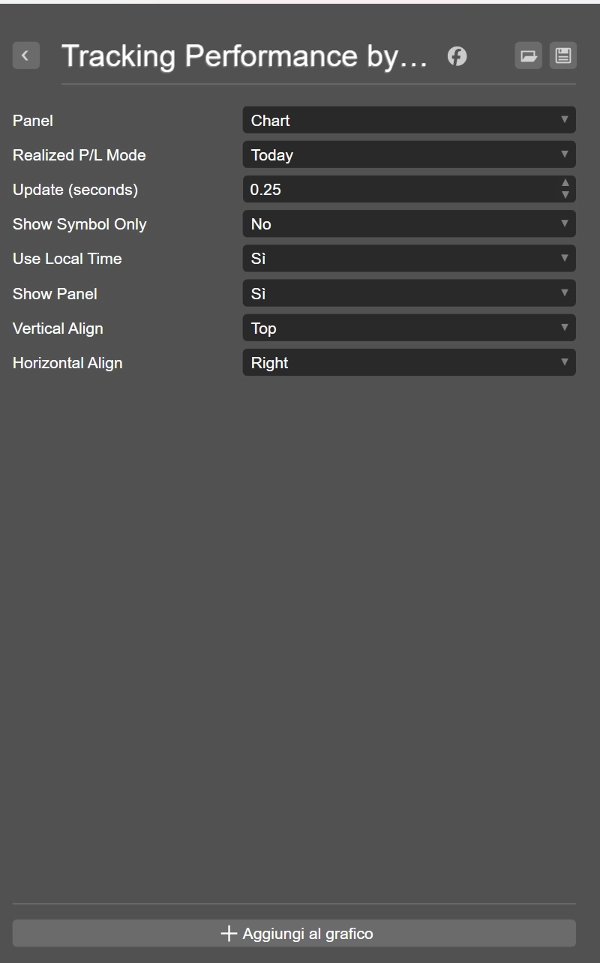
- Dodaj wskaźnik do wykresu
- Ustaw interwał aktualizacji (Update seconds)
- Użyj Show Panel, aby przełączać widoczność
- Użyj „Show Symbol Only”, aby filtrować do symbolu wykresu
- Użyj „Use Local Time”, aby zastosować lokalne filtry czasowe
Kluczowe parametry
- Update (seconds): częstotliwość odświeżania
- Show Symbol Only: wyświetlaj tylko symbol wykresu
- Use Local Time: używaj lokalnego czasu dla filtrów
- Show Panel: pokaż/ukryj panel
- Vertical/Horizontal Align: umiejscowienie panelu
Przypadki użycia
- Szybkie sprawdzenie ekspozycji netto na aktywo
- Codzienne i miesięczne śledzenie wyników
- Monitorowanie skuteczności dla jakości operacyjnej
- Monitorowanie spreadu % dla metali i kryptowalut
Zastrzeżenie
Handel wiąże się z ryzykiem. Wyniki z przeszłości nie gwarantują wyników w przyszłości.
Podsumowanie
Podsumowanie AI
Tracking Performance by Quantara is a dashboard indicator designed for real-time monitoring of trading performance across multiple assets. It provides key metrics including monthly and daily profit and loss (P/L), win rate, trade count, floating P/L, and spread percentage, with specific thresholds for metals and cryptocurrencies. The indicator also displays per-asset exposure categorized as long, short, or net positions. All values are dynamically color-coded to facilitate quick interpretation, highlighting positive/negative P/L, win-rate levels, and position types.
This tool is compatible with any trading instrument and timeframe, with a recommendation for use on main charts ranging from 15-minute to 4-hour intervals for daily performance tracking. Users can customize update frequency, toggle panel visibility, filter data to the current chart symbol, and apply local time settings. The indicator supports quick assessment of net exposure, daily and monthly performance, win-rate monitoring, and spread percentage analysis for metals and crypto markets.
Key parameters include update interval, symbol filtering, local time usage, panel display options, and panel alignment. This indicator is applicable across Forex, Indices, Commodities, Crypto, and Stocks markets.
Profil wskaźnika
Opinie klientów
0.0
Opinie: 0
Opinie klientów
Ten produkt nie ma jeszcze opinii. Wypróbowałeś(-aś) go już? Bądź pierwszy(-a) i powiedz o tym innym!
Dyskusja
Częste pytania
Forex
Indices
Commodities
Crypto
Stocks
Produkty dostępne za pośrednictwem cTrader Store, w tym boty handlowe, wskaźniki i wtyczki, dostarczane są przez deweloperów zewnętrznych i udostępniane wyłącznie w celach informacyjnych oraz w celu zapewnienia dostępu technicznego. cTrader Store nie jest brokerem i nie zapewnia doradztwa inwestycyjnego, nie udziela spersonalizowanych rekomendacji ani nie gwarantuje przyszłych wyników.


Cena
Od 29/01/2026
31
Bezpłatne instalacje