설명
개요
스윙 플로우는 가격 차트에 직접 표시되는 고급 추세 추종 지표로, 고전적인 슈퍼트렌드와 유사한 스타일의 깔끔하고 직관적인 시각 신호를 제공하지만, 근본적으로 다르고 더 정교한 기본 논리에 의해 작동합니다.
일반적인 추세 지표가 모든 캔들에 반응하는 반면, 스윙 플로우는 중요한 시장 스윙 포인트에 계산을 고정하여 훨씬 적은 노이즈와 잘못된 신호로 지배적인 추세를 진정으로 반영하는 선을 생성합니다.
작동 원리 (공식 공개 없이)
스윙 플로우는 시장에서 의미 있는 피벗 고점과 피벗 저점— 실제로 가격이 반전된 자연스러운 전환점—을 식별합니다. 그런 다음 이러한 피벗 주위에 동적 중간선과 두 개의 적응 밴드(상단 및 하단)를 구축하고, 단기 변동을 걸러내기 위해 변동성 조정 평활화를 적용합니다.
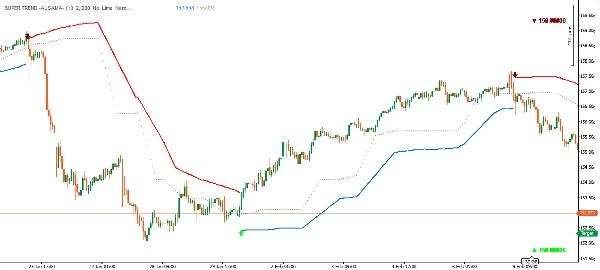
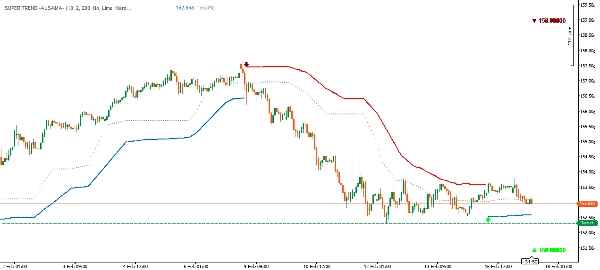
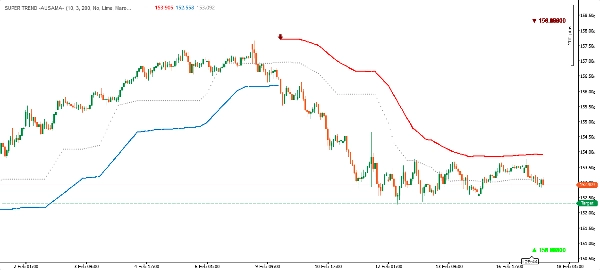
결과는 차트에 표시되는 단일 추세선입니다:
- 🟢 가격 아래 녹색 선 → 강세 추세 (동적 지지 역할)
- 🔴 가격 위 빨간 선 → 약세 추세 (동적 저항 역할)
추세가 전환되면 선은 슈퍼트렌드처럼 즉시 명확하고 실행 가능하도록 위치와 색상을 바꿉니다.
지표 구성 요소
구성요소설명
주요 추세선
주요 신호선 — 상승 추세 시 가격 아래 녹색, 하락 추세 시 가격 위 빨간색
상단 밴드
약세 국면에서 표시되는 동적 저항 수준
하단 밴드
강세 국면에서 표시되는 동적 지지 수준
중간선
시장 구조에서 파생된 적응형 중심선
신호 마커
모든 추세 반전 시 가격 라벨이 있는 상향/하향 화살표
피벗 라벨 (선택 사항)
스윙 고점과 저점에 다이아몬드 마커 (켜기/끄기 가능)
주요 장점
✅ 구조 기반 논리
최근 가격 움직임만 보는 대부분의 추세 지표와 달리, 스윙 플로우는 실제 스윙 피벗 포인트—시장이 이미 중요하다고 검증한 수준—를 기반으로 구축되어 추세 신호가 근본적으로 더 의미 있습니다.
✅ 적응형 변동성 필터
밴드는 현재 시장 변동성에 자동으로 조정되어, 안정적인 상황에서는 좁아지고 변동성이 클 때는 넓어집니다. 수동 조정 없이 휘핑 현상을 줄입니다.
✅ 깔끔한 슈퍼트렌드 스타일 디스플레이
고급 논리에도 불구하고 시각적 출력은 깔끔하고 익숙합니다. 차트에 한 줄 — 아래는 녹색, 위는 빨간색. 복잡하지 않고 어떤 타임프레임에서도 즉시 읽을 수 있습니다.
✅ 정확한 진입 신호
모든 추세 변화는 방향 화살표와 반전 바의 정확한 종가로 표시되어 명확한 진입 기준점을 제공합니다.
✅ 완전한 색상 맞춤 설정
강세 및 약세 색상 모두 차트 스타일이나 개인 취향에 맞게 완전히 맞춤 설정할 수 있습니다.
✅ 모든 시장 및 타임프레임에서 작동
외환, 지수, 원자재, 암호화폐 — 변동성 인식 설계 덕분에 어떤 상품과 타임프레임에도 자연스럽게 적응합니다.
사용 방법
추세 추종: 선 방향을 따라 추세를 따르세요 — 선이 녹색(가격 아래)일 때 매수, 선이 빨간색(가격 위)일 때 매도하거나 관망하세요.
동적 지지 및 저항: 활성 밴드는 실시간 지지(강세) 또는 저항(약세) 수준 역할을 합니다. 가격이 선을 깨지 않고 돌아오면 추세 지속 신호입니다.
진입 신호: 화살표 마커(▲ / ▼)는 확인된 추세 변화를 나타냅니다. 특히 차트의 다른 신호와 일치할 때 진입 트리거로 사용할 수 있습니다.
피벗 참조 (선택 사항): "고점 & 저점"을 활성화하여 지표가 내부적으로 사용하는 스윙 피벗 포인트를 표시하세요. 시장 구조를 한눈에 이해하는 데 유용합니다.
스윙 플로우 vs. 표준 슈퍼트렌드
특징표준 슈퍼트렌드스윙 플로우
계산 기준
모든 개별 캔들
검증된 시장 스윙 피벗
신호 노이즈
높음 — 각 바에 반응
낮음 — 구조에 고정
잘못된 신호
변동성이 큰 시장에서 더 흔함
현저히 감소
적응성
고정 ATR 배수
변동성 평활 밴드
시각적 스타일
단일 선
단일 선 + 밴드 + 중간선
진입 확인
색상 변경
반전 시 화살표 + 가격 라벨
피벗 가시성
없음
선택적 피벗 마커
요약: 스윙 플로우는 슈퍼트렌드처럼 보이지만 가격 행동 트레이더처럼 사고합니다.
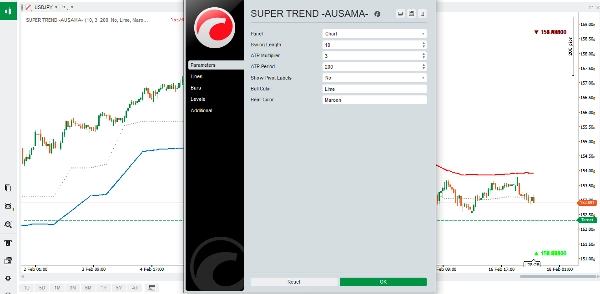
입력 매개변수
매개변수기본값설명
스윙 길이
10
피벗 감지 민감도 조절
ATR 배수
2.0
변동성 대비 밴드 폭
ATR 기간
200
변동성 측정용 조회 기간
피벗 라벨 표시
꺼짐
차트에서 스윙 고점/저점 마커 켜기/끄기
강세 색상
라임
강세 추세 색상
약세 색상
마룬
약세 추세 색상
최고 결과를 위한 팁
- 낮은 스윙 길이 (5–8): 더 민감하고 신호가 많음 — 스캘핑이나 적극적인 거래에 적합.
- 높은 스윙 길이 (14–20): 더 적고 고품질 신호 — 스윙 트레이딩이나 포지션 트레이딩에 적합.
- 변동성이 큰 시장(예: 암호화폐)에서는 ATR 배수를 증가하여 잘못된 전환을 방지하세요.
- 안정적이고 추세가 뚜렷한 시장에서는 ATR 배수를 감소하여 더 타이트한 신호를 얻으세요.
- 최고의 결과는 상위 타임프레임의 추세 확인과 함께 사용할 때 얻을 수 있습니다.
스윙 플로우 — 시장 구조와 추세 명확성이 만나는 곳.