Descrição
RollingCorrelation calcula a correlação de Pearson móvel entre cada preço de fechamento e seu atraso de 1 barra ao longo de uma janela configurável. O indicador retorna valores no intervalo [-1, 1], onde valores próximos de +1 indicam forte autocorrelação positiva (continuação da tendência), valores próximos de -1 indicam forte autocorrelação negativa (comportamento oscilatório ou de reversão) e valores próximos de 0 indicam pouca ou nenhuma autocorrelação linear.
Como funciona Para cada barra, calcula o coeficiente de correlação de Pearson entre a série de preços de fechamento e a mesma série deslocada por uma barra ao longo da janela do Período especificado (padrão 20). A implementação usa a fórmula padrão de covariância / variância para produzir um único valor de correlação por barra.
Entradas
- Período (int, padrão 20): número de barras na janela móvel. O indicador precisa de pelo menos Período+1 barras para calcular o primeiro valor.
Saída
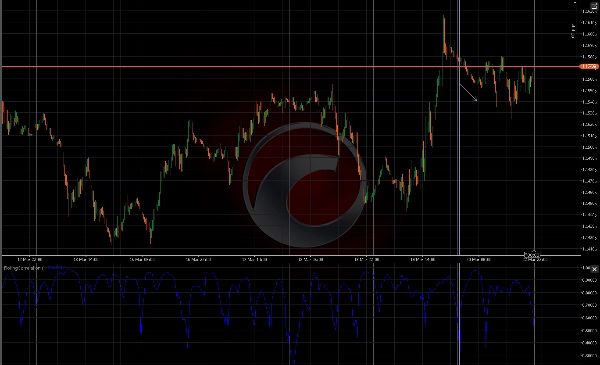
- Correlação (linha): valor da correlação móvel para cada barra, intervalo [-1, 1].
Interpretação e uso prático
- Próximo de +1: o preço mostra forte persistência — movimentos recentes provavelmente continuarão (útil para sinais de seguimento de tendência).
- Próximo de -1: forte autocorrelação negativa — o preço frequentemente reverte de uma barra para a outra (útil para táticas de reversão à média).
- Próximo de 0: nenhuma relação linear consistente no atraso 1 — o movimento do preço parece aleatório ao longo da janela.
- Padrões típicos de sinal: cruzamentos de limiar (ex., >0,6 ou <−0,6), aumentos/diminuições sustentados na correlação, divergência entre preço e correlação, ou filtragem de entradas de outros sistemas (requer correlação > 0,5 para entradas de tendência, ou < −0,5 para configurações de reversão).
Ideias de negociação
- Combine com filtros de volatilidade (ATR) para evitar sinais durante ruído de baixa volatilidade.
- Use junto com indicadores de tendência (médias móveis, MACD) para confirmar a direção quando a correlação for positiva.
- Use como gatilho de reversão à média de curto prazo quando a correlação for fortemente negativa e o preço estiver em um nível de suporte/resistência ou banda extrema de Bollinger.
- Intervalos de tempo curtos (ex., M1–M15) e períodos mais curtos podem ser usados para scalping; períodos/intervalos mais longos para confirmação de swing.
Configurações recomendadas
- Período padrão = 20 funciona bem como ponto de partida.
- Curto prazo: Período 8–14 (scalping / intradiário).
- Médio prazo: Período 20–50 (swing / confirmação de tendência).
- Evite definir Período muito grande em símbolos muito ruidosos ou muito pequeno em instrumentos de movimento muito lento.
Limitações e observações
- Requer pelo menos Período+1 barras para calcular os valores.
- Se a variância do preço dentro da janela for zero (preços estáveis), o denominador da correlação pode ser zero — isso pode produzir resultados NaN/indefinidos. Use valores sensatos para Período e assegure que o instrumento tenha movimento de preço suficiente.
- Este indicador mede apenas a correlação linear de atraso 1; não detecta relações não lineares ou atrasos de múltiplas barras.
- Não é um sistema de negociação independente — é melhor usado como filtro ou ferramenta de confirmação em uma estratégia.
Exemplos sugeridos para incluir na galeria
- EURUSD H1 com Período=20 mostrando forte correlação durante uma fase de tendência.
- BTCUSD 1H mostrando comportamento oscilatório e períodos de correlação negativa.
- XAUUSD 15m mostrando uso para scalping com Período curto.
Resumo
For each bar, the indicator computes the Pearson correlation coefficient between the series of close prices and the same series shifted by one bar within the specified period. This calculation uses standard covariance and variance formulas to generate a single correlation value per bar.
Traders can use this indicator to identify trend strength or potential reversals, applying threshold crossings or sustained changes in correlation as signals. It is useful for trend-following strategies when correlation is positive and for mean-reversion tactics when correlation is negative. The indicator can be combined with volatility filters and other trend indicators for confirmation. It supports various markets including Forex, stocks, indices, commodities, and cryptocurrencies, and is applicable across multiple timeframes from scalping (M1–M15) to swing trading.
The indicator requires at least Period+1 bars to compute values and is intended as a supplementary tool rather than a standalone trading system.