

설명
지그재그 지표
이 사용자 정의 가능한 지그재그 지표는 작은 가격 변동을 걸러내고 가장 중요한 스윙 고점과 저점만 일련의 선으로 연결하여 트레이더에게 시장 구조와 주요 전환점을 명확하게 시각화해 줍니다.
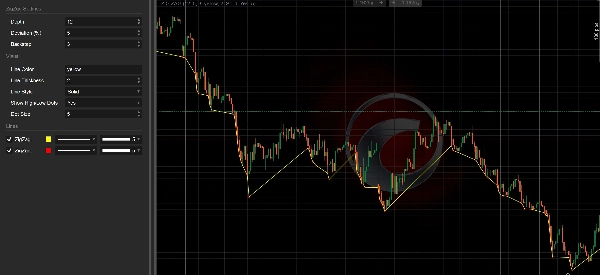
이 지표는 바의 롤링 윈도우(Depth)를 스캔하여 의미 있는 피벗을 식별하며, 이전 반대 지점에서의 움직임이 최소 Deviation 백분율을 초과할 때만 스윙을 확인합니다. Backstep 설정은 같은 유형의 두 피벗이 너무 가까이 등록되지 않도록 하여 출력이 깔끔하고 관련성을 유지하게 합니다.
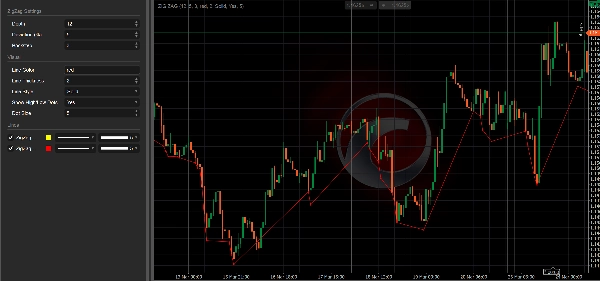
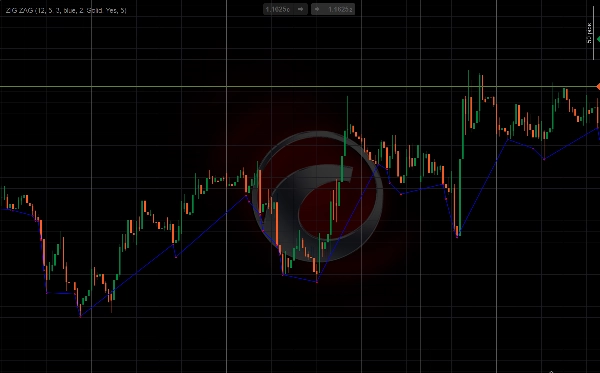
시각적으로, 연결된 선은 한눈에 추세 구조를 보여줍니다 — 상승하는 선은 더 높은 고점과 더 높은 저점을 나타내고; 하락하는 선은 더 낮은 고점과 더 낮은 저점을 나타냅니다. 선택적 점들은 각 확인된 피벗을 정확히 표시하여 지지, 저항 및 패턴 참조점으로 유용합니다.
주요 매개변수 — Depth, Deviation, 그리고 Backstep — 는 지표의 민감도를 조절합니다. 값이 높을수록 더 적고 큰 스윙을 생성하여 높은 시간대 분석에 적합하며; 값이 낮을수록 더 빈번한 피벗을 포착하여 단기 작업에 적합합니다. 선의 색상, 두께 및 스타일은 완전히 사용자 정의할 수 있습니다.
트레이더는 이 지표를 다음과 같이 사용할 수 있습니다: 추세 구조 분석, 지지 및 저항 매핑, 차트 패턴 인식(이중 천장/바닥, 머리와 어깨), 그리고 확인된 스윙 포인트에 피보나치 되돌림을 고정하는 데 활용할 수 있습니다.
어떤 거래 쌍에도 사용할 수 있습니다.
요약
AI 요약
The Zig Zag indicator is a customizable technical analysis tool designed to filter out minor price fluctuations and highlight significant swing highs and lows on a price chart. It operates by scanning a rolling window of bars (Depth) to identify meaningful pivot points, confirming swings only when price moves exceed a specified minimum Deviation percentage. The Backstep parameter prevents registering pivots of the same type too close together, ensuring clarity.
Visually, the indicator connects these pivots with lines that reveal market trend structure: rising lines indicate higher highs and lows, while falling lines show lower highs and lows. Optional dots mark confirmed pivots, which can serve as reference points for support, resistance, and chart pattern recognition.
Key adjustable settings—Depth, Deviation, and Backstep—allow users to tailor sensitivity for different timeframes, from capturing large swings on higher timeframes to more frequent pivots on shorter-term charts. Line color, thickness, and style are fully customizable.
Traders use the Zig Zag indicator for analyzing trend structure, mapping support and resistance levels, identifying classical chart patterns such as head and shoulders, double tops/bottoms, and anchoring Fibonacci retracements to confirmed swing points. It is applicable to any trading pair and supports visualization and signal outputs for breakout and reversal events based on bar data.
Visually, the indicator connects these pivots with lines that reveal market trend structure: rising lines indicate higher highs and lows, while falling lines show lower highs and lows. Optional dots mark confirmed pivots, which can serve as reference points for support, resistance, and chart pattern recognition.
Key adjustable settings—Depth, Deviation, and Backstep—allow users to tailor sensitivity for different timeframes, from capturing large swings on higher timeframes to more frequent pivots on shorter-term charts. Line color, thickness, and style are fully customizable.
Traders use the Zig Zag indicator for analyzing trend structure, mapping support and resistance levels, identifying classical chart patterns such as head and shoulders, double tops/bottoms, and anchoring Fibonacci retracements to confirmed swing points. It is applicable to any trading pair and supports visualization and signal outputs for breakout and reversal events based on bar data.
지표 프로필
지표 카테고리
추세
출력 유형
시각화
신호
데이터 요구 사항
막대만
지원되는 신호
돌파
반전
고객 리뷰
4.4
리뷰: 5
5 | 40 % | |
4 | 60 % | |
3 | 0 % | |
2 | 0 % | |
1 | 0 % |
고객 리뷰
May 31, 2026
May 30, 2026
May 23, 2026
it feels useful once the click feels less impulsive, and half size is enough at the start.
May 22, 2026
ZIG ZAG is a classic market structure indicator that helps simplify price action by filtering out minor noise and highlighting meaningful swing highs and lows. It works well for trend structure analysis, Fibonacci anchoring, and chart pattern recognition. Lightweight, flexible, and visually clean, it remains one of the most practical tools for discretionary technical analysis.
May 22, 2026
The first 10 trades should stay boring, and the trade idea gets slowed down first.
상담
자주 묻는 질문(FAQ)
Premium/Discount
Head and Shoulders
Flag
Key Levels
Market Structure
Supply & Demand
Support & Resistance
트레이딩 봇, 지표, 플러그인 등 cTrader Store에서 제공되는 상품은 제3자 개발자에 의해 제공되며, 이는 단순히 정보 및 기술적 접근을 목적으로 제공된 것입니다. cTrader Store는 중개인이 아니며, 투자 조언, 개인별 추천 또는 향후 성과에 대한 어떠한 보장도 제공하지 않습니다.
이 작성자의 상품 더 보기



















!["[CB] Pivot Points Pro" 로고](https://cdn.ctrader.com/image/webp/43463c82-67b0-4f10-a4ba-901bba091d81_32594)


가격
82.74M
거래량
50.16K
핍 수익
6
판매
445
무료 설치