الوصف
مؤشر القيمة التكرارية الجوهرية
نظرة عامة
الالقيمة التكرارية الجوهرية هو مؤشر مخصص يستخدم حسابات القوة النسبية التكرارية عبر فترات متعددة لتحديد الاتجاهات السوقية الجوهرية. يحدد مستويات السعر الرئيسية حيث تصل قوة الاتجاه إلى مستوى حرج، مما يوفر رؤى حول الانعكاسات المحتملة وتأكيدات الاتجاه. مفهوم القيمة التكرارية الجوهرية يستند إلى فكرة أن زخم السوق وقوة الاتجاه يمكن تحسينها بشكل تكراري من خلال تطبيق طبقات متعددة من تحليل حركة السعر. تساعد هذه الطريقة التكرارية في تحديد الظروف الصعودية والهبوطية العميقة الجذور التي قد تتجاهلها المؤشرات التقليدية المعتمدة على السعر.
مناطق التداول الصعودية والهبوطية
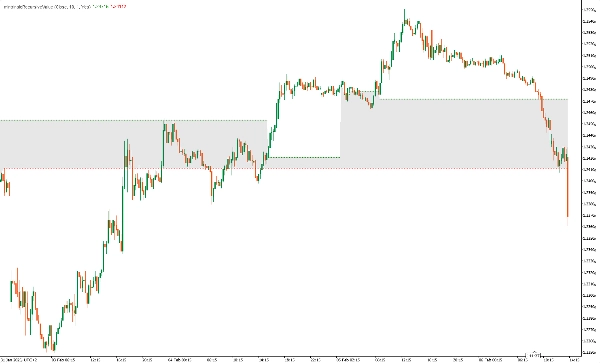
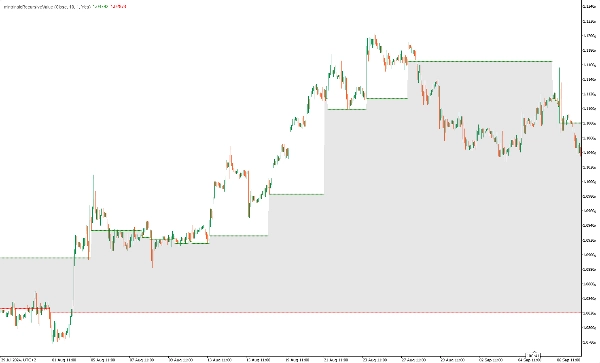
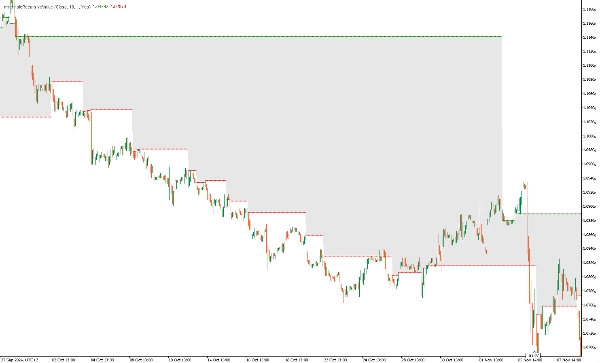
- منطقة التداول الصعودية: تتشكل هذه المنطقة عندما تؤكد القيمة التكرارية الجوهرية قوة صعودية مستمرة. تحدث عندما تشير جميع حسابات القوة النسبية التكرارية إلى قيم مستمرة فوق التوازن، مما يشير إلى زخم صعودي قوي. تساعد منطقة التداول الصعودية المتداولين على تحديد نقاط دخول طويلة محتملة ومناطق دعم ديناميكية حيث قد يستمر السعر في الارتفاع.
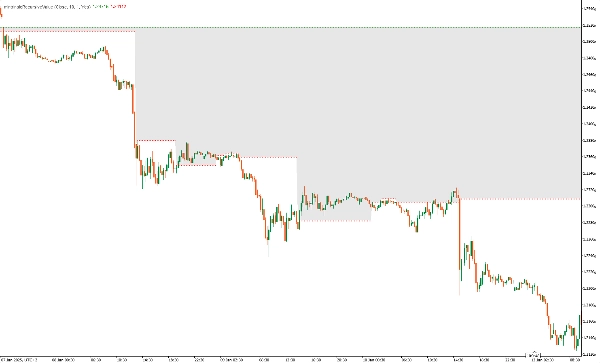
- منطقة التداول الهبوطية: تُنشأ هذه المنطقة عندما تحدد القيمة التكرارية الجوهرية قوة هبوطية مستمرة. عندما تكون جميع قيم القوة النسبية التكرارية تحت التوازن، فإنها تشير إلى اتجاه هابط مستمر، مما يوفر للمتداولين فرصًا للدخول في صفقات قصيرة وتحديد مستويات مقاومة ديناميكية حيث قد يستمر السعر في الانخفاض.
مخرجات المؤشر
- outIntrinsicRecursiveLong : يعرض المستوى الطويل الجوهري عند اكتشاف قوة صعودية.
- outIntrinsicRecursiveShort: يعرض المستوى القصير الجوهري عند اكتشاف قوة هبوطية.
الاستخدام
- تأكيد الاتجاه: يساعد في تحديد الاتجاهات الصعودية أو الهبوطية القوية عندما تتوافق جميع فترات القوة النسبية.
- كشف الانعكاس: يشير إلى نقاط تحول محتملة عندما تتغير القيمة الجوهرية.
- مستويات الدعم والمقاومة: تعمل القيم الجوهرية كمستويات دعم ومقاومة ديناميكية.
استراتيجية تداول نموذجية
- دخول طويل: ادخل صفقة شراء عندما يتم تأسيس المستوى الطويل الجوهري وتؤكد حركة السعر الزخم الصعودي، وهذا يعني أن السعر فوق قيمة التوازن (المكون الأخضر للمؤشر).
- دخول قصير: ادخل صفقة بيع عندما يتم تأسيس المستوى القصير الجوهري وتؤكد حركة السعر الزخم الهبوطي، وهذا يعني أن السعر تحت قيمة التوازن (المكون الأحمر للمؤشر).
- استراتيجية الخروج: استخدم وقف الخسارة المتحرك أو اختفاء المستويات الجوهرية للخروج من الصفقات
ملاحظات
- تم تصميم المؤشر لاستراتيجيات متابعة الاتجاه ويعمل بشكل أفضل في الأسواق ذات الاتجاه الواضح.
- يمكن دمجه مع مؤشرات أخرى مثل مؤشرات الزخم لتأكيد صفقات التحفيز.
الخلاصة
المؤشر القيمة التكرارية الجوهرية هو أداة قوية للمتداولين الذين يسعون لتعزيز تحليل الاتجاه باستخدام حسابات القوة النسبية التكرارية. من خلال تحديد مستويات السعر الرئيسية مع اتجاهات عالية الاحتمالية، يوفر هذا المؤشر رؤى قيمة حول اتجاه السوق وفرص التداول المحتملة.
الملخص
The indicator defines Bullish and Bearish Trade Zones: the Bullish Trade Zone signals sustained upward momentum when all recursive strength values exceed equilibrium, suggesting potential long entry points and dynamic support levels. Conversely, the Bearish Trade Zone indicates ongoing downtrends when values fall below equilibrium, identifying short entry opportunities and dynamic resistance levels.
Outputs include intrinsic long and short levels that display when bullish or bearish strength is detected. Use cases encompass trend confirmation, reversal detection, and identification of dynamic support and resistance levels. An example strategy involves entering long trades when intrinsic long levels align with bullish price action and short trades when intrinsic short levels coincide with bearish momentum, with exits managed via trailing stops or disappearance of intrinsic levels.
Designed primarily for trend-following strategies in trending markets, this indicator can be combined with other momentum tools for trade confirmation.