
설명
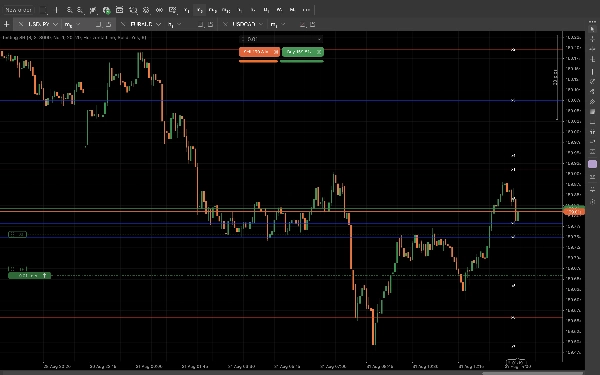
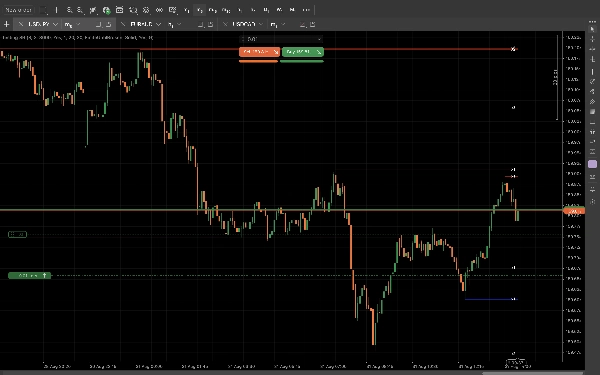
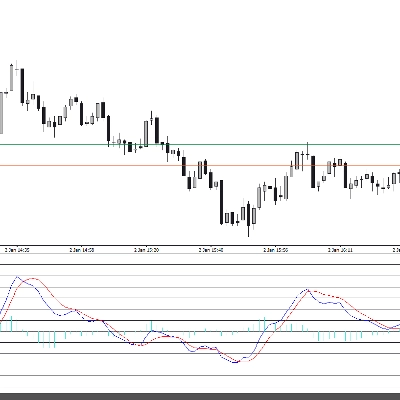
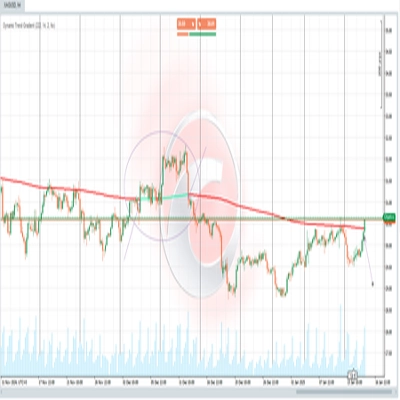
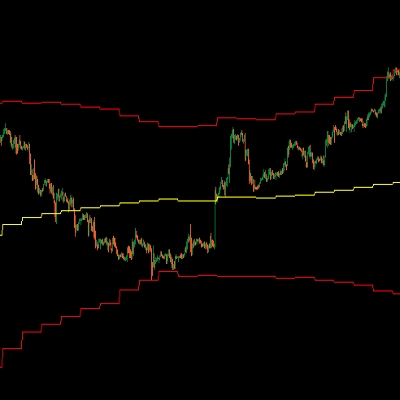
간단한 지지선 및 저항선 은(는) 모든 차트 시간대에서 주요 전환점을 자동으로 계산하고 작업 공간을 복잡하게 하지 않으면서 깔끔하고 매우 얇은 수준을 그립니다.
주요 기능
- 깔끔하고 방해되지 않음: 캔들을 압도하지 않으면서 주요 시장 구조를 강조하는 최소한의 얇은 가격 수준을 표시합니다.
- 스마트 혼잡 필터링: 내장된 핍 중첩 방지 기능은 겹치는 선을 방지하면서 세밀하고 고정밀 스윙 포인트를 유지합니다.
- 여러 시간대 마스터하기: 1분 스캘핑부터 일간 차트 스윙까지 원활하게 분석하며 전체 거래 기록에 걸쳐 정밀하고 깔끔한 수준 감지를 제공합니다.
- 선택적 지역 집중: 즉각적인 거래 영역에 표시되는 선을 제한하여 가격 움직임에 집중할 수 있습니다.
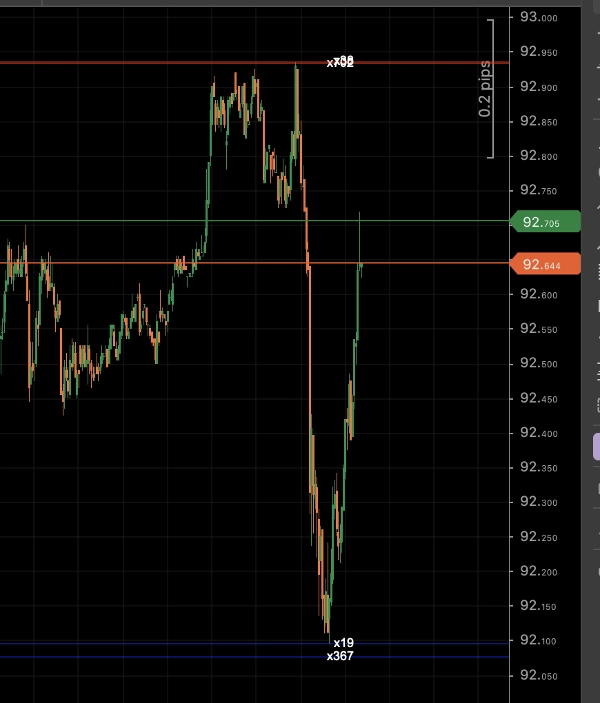
- 역사적 강도: 지지선 또는 저항선이 터치된 횟수를 표시합니다.
- 완전한 사용자 정의 스타일링: 색상, 선 두께, 스윙 민감도 및 최대 선 수를 조정하여 템플릿 설정에 맞출 수 있습니다.
요약
AI 요약
Simple Support and Resistance is a technical indicator that automatically identifies and plots key price turning points on any chart timeframe. It draws clean, ultra-thin support and resistance lines to highlight important market structure levels without cluttering the chart. The indicator features smart clutter filtering that prevents overlapping lines while maintaining high-precision swing points. It supports multiple timeframes, enabling analysis from 1-minute scalping to daily swings, and can focus locally on immediate trading areas by limiting visible lines. The indicator also displays the historical strength of each level by showing how many times it has been touched. Users can fully customize the styling, including colors, line thickness, swing sensitivity, and maximum line counts, to fit their chart setup. This tool is designed to assist traders in visually identifying key market levels for better decision-making across various trading styles and timeframes.
지표 프로필
지표 카테고리
지지 및 저항
출력 유형
시각화
신호
데이터 요구 사항
막대만
지원되는 신호
레벨 돌파
반전
상담
고객 리뷰
0.0
리뷰: 0
고객 리뷰
이 상품에 대한 리뷰가 아직 없습니다. 이미 사용해 보셨나요? 다른 사람들에게 가장 먼저 소개해 주세요!
자주 묻는 질문(FAQ)
Key Levels
MSS
Market Structure
Support & Resistance
트레이딩 봇, 지표, 플러그인 등 cTrader Store에서 제공되는 상품은 제3자 개발자에 의해 제공되며, 이는 단순히 정보 및 기술적 접근을 목적으로 제공된 것입니다. cTrader Store는 중개인이 아니며, 투자 조언, 개인별 추천 또는 향후 성과에 대한 어떠한 보장도 제공하지 않습니다.










가격

가입일 25/08/2026