present
가입하고 첫 구매 시 $50 할인을 받으세요
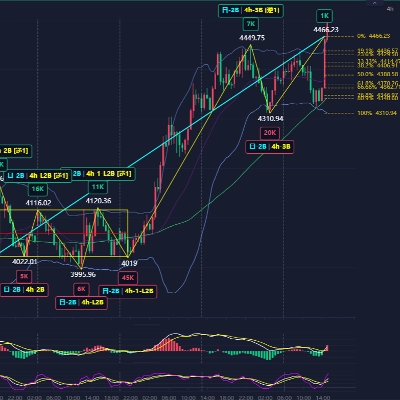
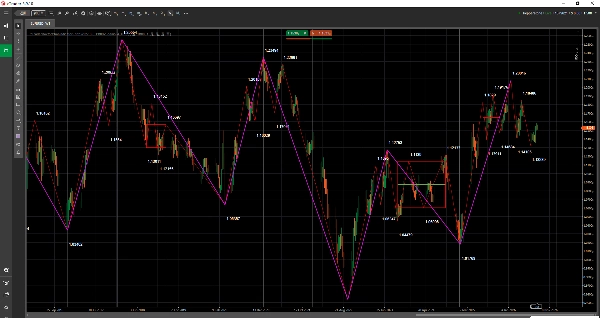
Trading product for Boshi Chanlun Structure 지표 ADX Key Levels, image 1
Boshi Chanlun Structure
지표
버전 1.0, Sep 2026
Windows, Mac
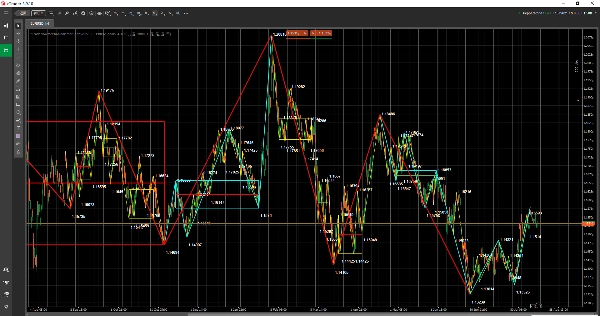
Trading product for Boshi Chanlun Structure 지표 ADX Key Levels, image 2
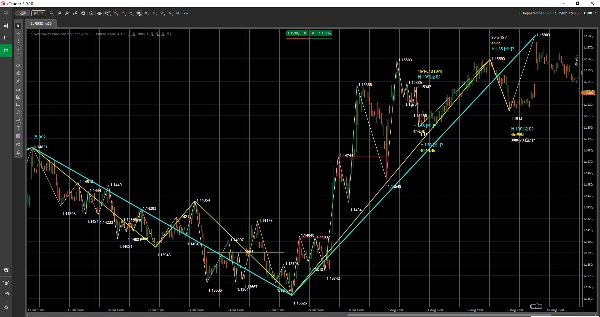
Trading product for Boshi Chanlun Structure 지표 ADX Key Levels, image 3
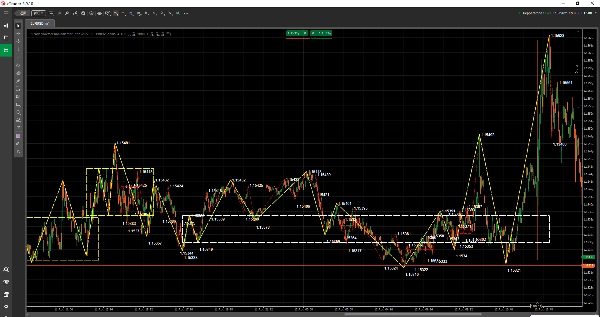
Trading product for Boshi Chanlun Structure 지표 ADX Key Levels, image 4
Trading product for Boshi Chanlun Structure 지표 ADX Key Levels, image 5
Trading product for Boshi Chanlun Structure 지표 ADX Key Levels, image 6
Trading product for Boshi Chanlun Structure 지표 ADX Key Levels, image 7
Trading product for Boshi Chanlun Structure 지표 ADX Key Levels, image 8
Trading product for Boshi Chanlun Structure 지표 ADX Key Levels, image 9
Trading product for Boshi Chanlun Structure 지표 ADX Key Levels, image 10
가입일 10/08/2026

설명

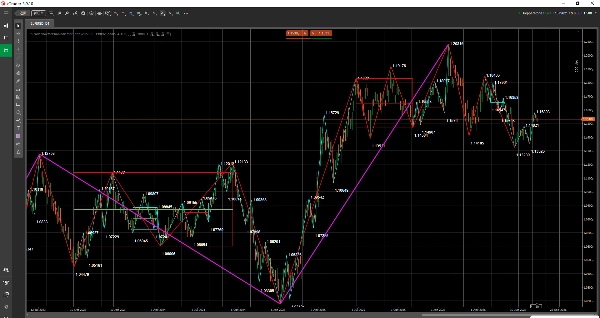
Dr. Chanlun Structure Indicator for cTrader is a market structure / chart overlay technical analysis indicator used to display Chanlun structures on cTrader charts.


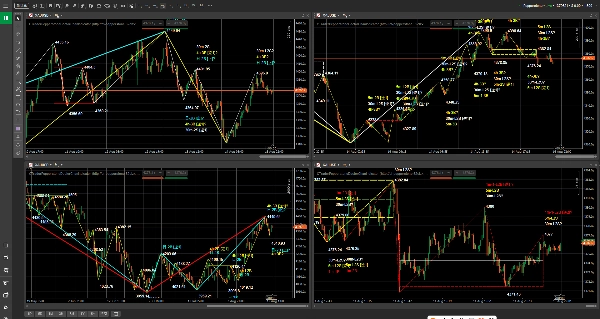
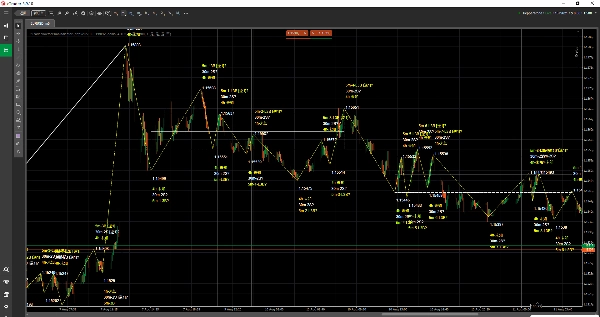
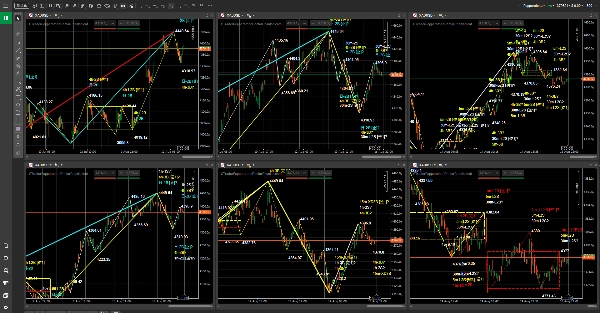
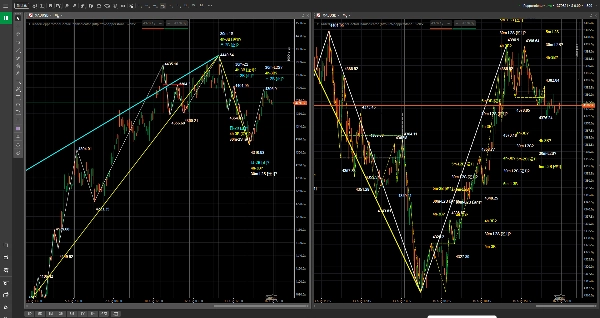
It is suitable for traders who focus on price action, trend structure and multi-timeframe analysis. The indicator displays key Chanlun structures as chart objects, including Bi structures, Zhongshu zones, buy/sell markers and more, helping users observe market rhythm, structural changes and relationships between different timeframes more intuitively.


This indicator is not an automated trading robot and is not a trading signal service. Its purpose is to help users read charts, review markets and build trading plans more clearly.


The current version is compatible with specified Pepperstone cTrader symbols and timeframes. This product is an independent third-party indicator and is not an official Pepperstone product or a Pepperstone partner product.


Indicator overview


- Indicator type: market structure / chart overlay indicator.

- Preferred instruments: specified Forex, indices, commodities, cryptocurrencies and stock CFD symbols in Pepperstone cTrader.

- Preferred timeframes: 1 minute, 5 minutes, 15 minutes, 30 minutes, 1 hour, 4 hours, daily, weekly and monthly.

- Trading use case: chart structure observation, multi-timeframe analysis, trading plan preparation and review support.


What you can see on the chart


- Bi structures: used to observe swing rhythm and structural progression.

- Zhongshu zones: used to observe important consolidation, balance and structural overlap areas.

- Buy/sell markers: used to help locate key structural reference points.

- Text labels, horizontal lines, vertical lines, rectangular areas, trend lines and other chart objects.

- Automatic data matching with the current chart timeframe is supported by default, making multi-timeframe observation easier.


Who this indicator is for


- Users who are learning or using Dr. Chanlun Structure Indicator and Chanlun structure analysis.

- Users who want to view structure information directly on cTrader charts.

- Users who use Pepperstone to view Forex, indices, commodities, cryptocurrencies or stock CFDs.

- Traders who need to compare trend structures across different timeframes.

- Users who want to make chart reading, planning and review workflows clearer.


Access and licensing


Product access and licensing are managed through the cTrader Store purchase, trial and installation process. Please refer to the purchase status, trial status and product information shown on the cTrader Store product page.


Currently supported Pepperstone symbols


Forex:

GBPUSD, EURUSD, USDJPY, USDCHF, AUDUSD, USDCAD, GBPJPY


Indices:

US500, NAS100, GER40, UK100, JPN225, VIX, HSTECH


Commodities:

XAUUSD, XAGUSD


Cryptocurrencies:

BTCUSD, ETHUSD


Stocks:

AAPL.US-24, MSFT.US-24, GOOG.US-24, AMZN.US-24, TSLA.US-24, NVDA.US-24, META.US-24, NFLX.US-24, JPM.US-24


Supported timeframes


1 minute, 5 minutes, 15 minutes, 30 minutes, 1 hour, 4 hours, daily, weekly and monthly.


Suggested workflow


1. Open a chart for a supported symbol in the Pepperstone cTrader environment.

2. Load Dr. Chanlun Structure Indicator onto the chart.

3. The Dr. Chanlun Structure Indicator data time is UTC+0. When checking chart structures, make sure to switch the cTrader chart time zone to the corresponding time zone before comparing positions.

4. Make sure the current chart timeframe is supported. The indicator automatically matches data to the chart timeframe.

5. Turn "Show Bi", "Show Zhongshu" and "Show Buy/Sell" on or off as needed.

6. Observe the chart structure together with your own trading plan, position management and risk control.


Parameter settings


The current version exposes only the following 3 visible parameters in the cTrader indicator panel. Data timeframe, broker symbol suffix, cache, refresh, compressed transfer and logging settings are managed internally by the indicator and do not need to be configured for normal use.


Show Bi


Default value: "true"


Whether to display Bi structures.


Show Zhongshu


Default value: "true"


Whether to display Zhongshu zones.


Show Buy/Sell


Default value: "true"


Whether to display buy/sell markers.


Important notes


- This product is a technical analysis assistant indicator, not an automated trading robot.

- The indicator does not place orders automatically.

- The indicator does not constitute investment advice, a trading signal service or a profit guarantee.

- The current version is compatible only with specified Pepperstone cTrader symbols and specified timeframes.

- The Dr. Chanlun Structure Indicator data time is UTC+0. When displaying it on a cTrader chart, please switch to the corresponding chart time zone before checking structure positions.

- Users should use it together with their own trading plan, position management, risk control and independent judgment.


Future update direction


The current release version prioritizes specified Pepperstone cTrader symbols and timeframes. Future updates may continue to expand more brokers, more symbol mappings and a more complete data service scope according to the product plan.


Risk warning


Financial market trading involves risk. Past performance does not guarantee future results. This indicator is only a technical analysis and learning assistant tool. It does not constitute investment advice, a trading signal service or a profit guarantee. Historical structures do not represent future results. Users should fully test it in their own trading environment and use it carefully together with risk management rules.

요약

지표 프로필
지표 카테고리
시장 구조 (SMC)
출력 유형
시각화
데이터 요구 사항
막대만
외부 데이터
지원되는 신호
크로스
다이버전스
돌파
반전
추세 강도
변동성

고객 리뷰

0.0
리뷰: 0
고객 리뷰
이 상품에 대한 리뷰가 아직 없습니다. 이미 사용해 보셨나요? 다른 사람들에게 가장 먼저 소개해 주세요!

상담

자주 묻는 질문(FAQ)

ADX
Key Levels
Market Structure
MACD
Support & Resistance
트레이딩 봇, 지표, 플러그인 등 cTrader Store에서 제공되는 상품은 제3자 개발자에 의해 제공되며, 이는 단순히 정보 및 기술적 접근을 목적으로 제공된 것입니다. cTrader Store는 중개인이 아니며, 투자 조언, 개인별 추천 또는 향후 성과에 대한 어떠한 보장도 제공하지 않습니다.

좋아하실 만한 다른 항목

지표
Breakout
Open Range Breakout by SLA is a fully customizable multi-session indicator designed for structured intraday traders.
지표
SMC
VWAP
+4
Killzone Session and key levels with VWAP – Precision Meets Price Action
지표
RSI
BTCUSD
+6
This histogram helps visualize the strength and direction of market movements, making it easier to spot potential trends
지표
ATR
Channel
+3
Catch trend with precision. BUY/SELL arrows, real-time dashboard, sound alerts and ATRchannel. Works on all markets.
지표
Forex
EURUSD
+3
ATR-normalized MA slope in degrees, comparable across all instruments. Color-coded labels flag strong trend moves.
지표
Show your Daily/Weekly Risk
"Vwap Bands" 로고
최고 평점
4.5
(4)
지표
VWAP
Moving Average
Vwap Bands it is highly sought after by professional traders because it includes Standard Deviation Bands
지표
EMA
A visual signal backtester that simulates trades directly on your chart and scores strategy performance.
지표
Signal
Scalping
Average accuracy of around 60% to 70% on 45min timeframes it is highly recommended to use stop losses
"macdZR" 로고
최고 평점
4.6
(5)
지표
MACD
Forex
+5
MACD ZERO LAG. Get faster signals, earlier trend detection, and eliminate the delay of traditional moving averages
지표
BOS
CHOCH
+5
BOS/CHoCH signals confirmed by liquidity sweep + FVG confluence, with a live conviction score.
지표
ATR
EMA
+4
SCALPING M1 CTRADER v1.0 — Institutional-Grade M1 Gold & Forex Scalping System
지표
Prop
Forex
+5
Pivot Point with base zone daily Asia-London-New york Session.
지표
This indicator is a simple, single-timeframe tool for showing candle sentiment directly on your chart. If you want a mor
지표
AI
ATR
+19
QX SessionBox ORB: Session boxes + ORB levels + clean dashboard with optional closed-candle breakout signals.
지표
RSI
BTCUSD
+5
Identify market structure effortlessly with swing highs, lows, CHoCH, and BOS levels for smart trading decisions! 📊🔍"
지표
ATR
BTCUSD
+5
Trailing algo 📈 auto-tracks trends 🎯 adapts to volatility 🌟 precise moves 🛡️ retest signals 🚀 no lag, smart market
지표
ATR
MSS
+5
Grades ICT Unicorn setups (Breaker Block + FVG confluence) into PRIME / SETUP / WATCH, with retest & RR targets.

가격

가입일 10/08/2026