present
가입하고 첫 구매 시 $50 할인을 받으세요
Trading product for Helix Volume Profile 지표 Key Levels Volume, image 1
Helix Volume Profile
지표
버전 1.0, Sep 2026
Windows, Mac
Trading product for Helix Volume Profile 지표 Key Levels Volume, image 2
Trading product for Helix Volume Profile 지표 Key Levels Volume, image 3
Trading product for Helix Volume Profile 지표 Key Levels Volume, image 4
Trading product for Helix Volume Profile 지표 Key Levels Volume, image 5
Trading product for Helix Volume Profile 지표 Key Levels Volume, image 6
Trading product for Helix Volume Profile 지표 Key Levels Volume, image 7
Trading product for Helix Volume Profile 지표 Key Levels Volume, image 8
Trading product for Helix Volume Profile 지표 Key Levels Volume, image 9
Trading product for Helix Volume Profile 지표 Key Levels Volume, image 10
Trading product for Helix Volume Profile 지표 Key Levels Volume, image 11

설명

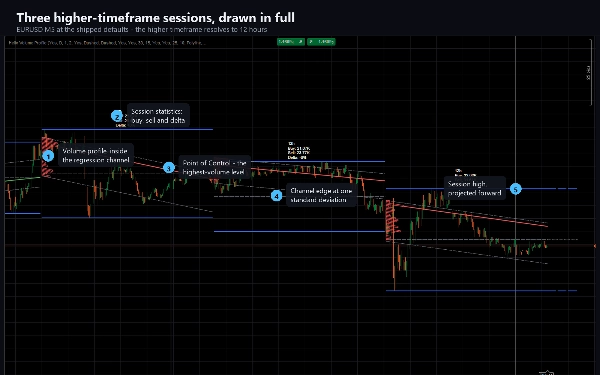
Helix Volume Profile builds a complete picture of the higher-timeframe session that the current chart sits inside.

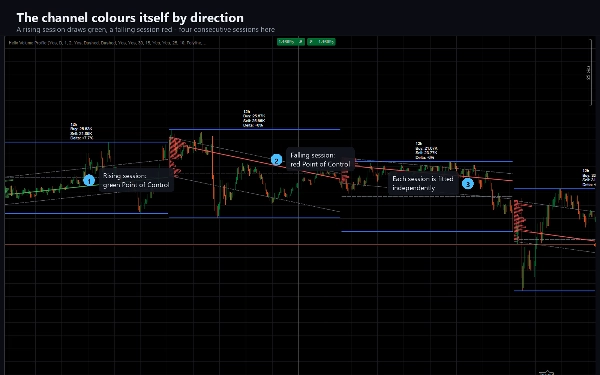
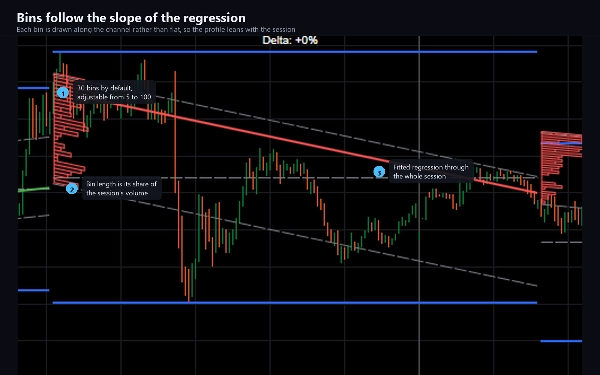
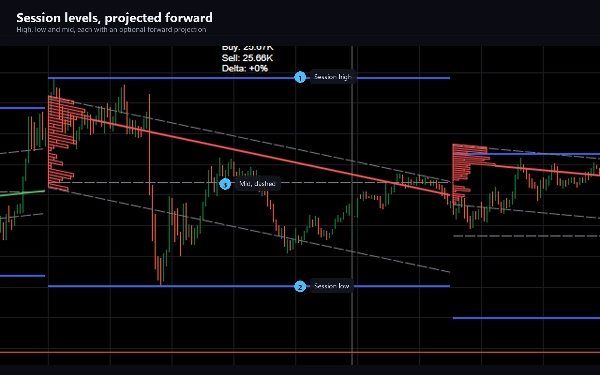
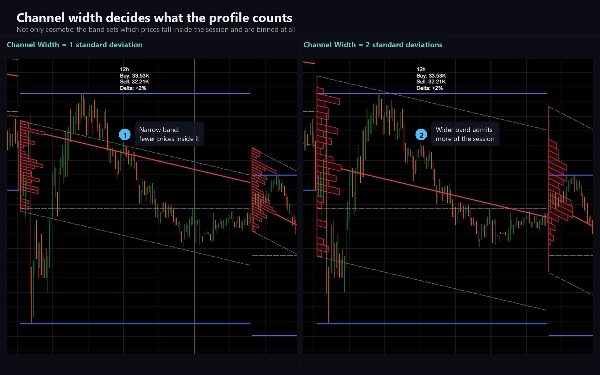
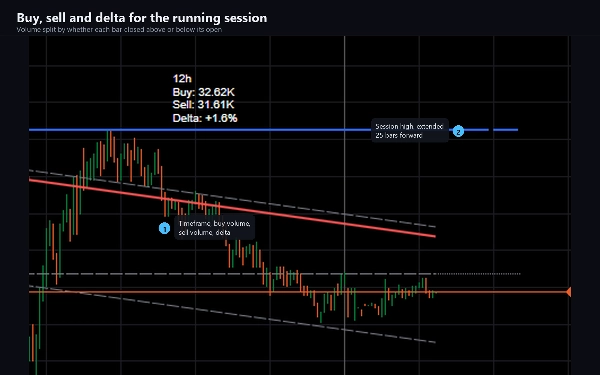
For each session it fits a logarithmic regression across every bar so far, draws a channel a configurable number of standard deviations wide around it, and fills that channel with a volume profile whose bins follow the slope of the regression rather than sitting flat. The highest-volume bin is marked with a Point of Control line, coloured to the direction the channel is travelling. The session's high, low and mid levels are drawn alongside and can be projected forward, and a compact label reports buy volume, sell volume and the delta between them.

The higher timeframe is chosen for you by default and adapts to the chart: a 12-hour session on M5, four hours on M1, two days on M15, a week on H1, a month on H4. You can switch that off and set the session yourself - minutes, days, weeks or months are all accepted.

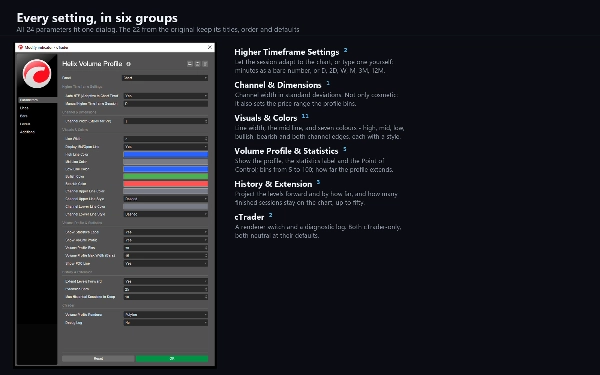
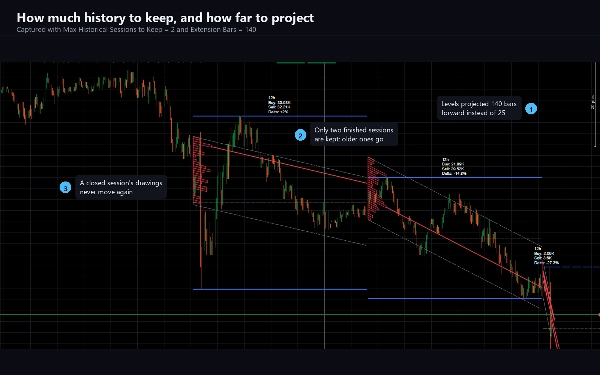
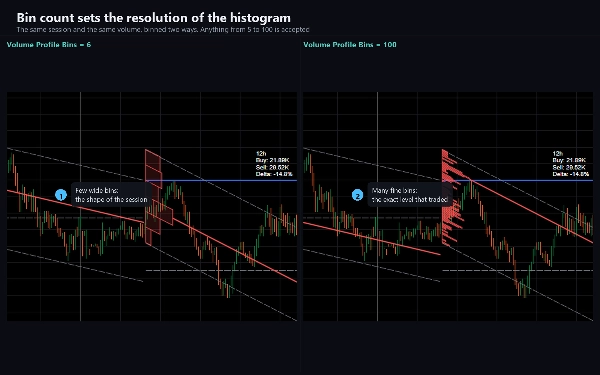
Everything is adjustable. Channel width, the number of profile bins from 5 to 100, how far the profile extends, whether the Point of Control, the statistics label and the forward projections are shown, the line widths and styles, seven colours, and how many finished sessions stay on the chart, up to fifty.

WHAT IT IS FOR

Reading where price sits inside its higher-timeframe structure without leaving your working timeframe. The channel shows the session's drift and dispersion; the profile shows where volume actually accumulated inside it; the Point of Control marks the level that saw the most activity. Traders use these to frame support and resistance, to judge whether a move is stretched relative to the session, and to see whether buying or selling dominated.

Suitable for any instrument and any timeframe. It is most informative on intraday charts from M1 to H4, where the adaptive session gives a meaningful window; on Daily and higher, set the session manually.

HOW IT BEHAVES

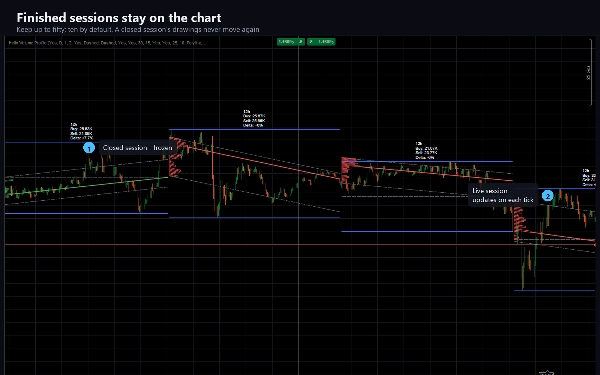
The live session updates on every tick and its drawings move until the session closes - the channel is refitted, the profile rebuilt and the levels re-measured as each bar arrives. Once a session ends its drawings are frozen and never change again. This is deliberate and it is how the method works; if you need levels that never move intrabar, read a closed session rather than the live one.

Volume on a forex symbol is the tick count your broker reports, so the profile reflects your own feed.

TECHNICAL

Indicator, overlay. 24 parameters. No trading permissions, no file access and no network access - it is built with AccessRights set to None and cannot place an order. Includes a trial edition restricted to EURUSD with no time limit and no disabled features.

Documentation covers installation, every parameter with its purpose, and a troubleshooting guide that explains each behaviour that surprises people.

Trading involves risk. Past performance does not guarantee future results.

요약

지표 프로필
지표 카테고리
추세
출력 유형
시각화
데이터 요구 사항
거래량

고객 리뷰

0.0
리뷰: 0
고객 리뷰
이 상품에 대한 리뷰가 아직 없습니다. 이미 사용해 보셨나요? 다른 사람들에게 가장 먼저 소개해 주세요!

상담

자주 묻는 질문(FAQ)

Key Levels
Volume
Market Structure
Channel
Support & Resistance
트레이딩 봇, 지표, 플러그인 등 cTrader Store에서 제공되는 상품은 제3자 개발자에 의해 제공되며, 이는 단순히 정보 및 기술적 접근을 목적으로 제공된 것입니다. cTrader Store는 중개인이 아니며, 투자 조언, 개인별 추천 또는 향후 성과에 대한 어떠한 보장도 제공하지 않습니다.

이 작성자의 상품 더 보기

지표
ATR
BOS
+5
Know how strong each Supertrend flip is: scored BUY/SELL, structure stop + 3 targets, live win-rate dashboard, alerts.
지표
ADX
ATR
+5
Scored breakouts of sloped pivot trendlines: four filters on the break bar, ATR stop, 1:1 / 1:2 / 1:3 targets, alerts.
지표
ATR
RSI
+5
Supply and demand zones with break of structure, higher timeframe MA signals, a percent stop and three targets.
지표
ATR
Volume
+3
Fibonacci trend signals on closed bars, with an ATR stop, up to four targets and a break-even ladder.
지표
ADX
ATR
+5
Ten confluence layers scored on every closed bar, with an anti-chop gate, pivot levels and a live dashboard.
지표
Volume
Key Levels
+1
Fixed-grid volume profile: bull and bear volume at every price level, with Point of Control and value area.
지표
ADX
ATR
+5
SuperTrend signals scored on five confluence factors, with an ATR stop, three targets and a dashboard.

좋아하실 만한 다른 항목

지표
This indicator can be used to: change color, shape size, position, change font, increase or decrease, and other function
지표
ADX
ATR
+5
SuperTrend signals scored on five confluence factors, with an ATR stop, three targets and a dashboard.
지표
ZLSMA: Zero-lag trend indicator! Catch trends fast with customizable settings. Boost your trading precision.
지표
Volume
Key Levels
+2
Support and resistance from a rolling volume profile, ranked by strength or recency, updated live.
지표
AI
ATR
+26
MacD Custom Indicator-Multiple Time Frame
지표
ATR
RSI
+5
Supply and demand zones with break of structure, higher timeframe MA signals, a percent stop and three targets.
지표
Prop
Forex
+4
It draws Pivot Levels on the chart.
지표
Support & Resistance
Detects Gartley, Bat, Butterfly, Crab, Shark & Cypher patterns and backtests each one's real win rate.
지표
ATR
Volume
+5
Order blocks with measured hold-rate stats and confidence scoring — not just zones on a chart.
지표
Forex
BTCUSD
+11
Master trends with Smart ADX: MTF Scanner, precise Buy/Sell signals, Divergence & clear Exit targets 🎯
지표
AI
ATR
+20
Buy and Sell Signals
지표
Forex
Crypto
+4
Pro Heikin Ashi Visual Overlay – Clean Trend Visualization
지표
ADX
ATR
+5
Precision Sniper by PrimeQuant: Advanced confluence engine with auto-presets, dynamic TP/SL, and live backtest stats.
지표
Forex
Crypto
+3
Day of Week Indicator for cTrader
지표
RSI
Forex
+10
Unlock Stochastic RSI PRO in cTrader! Overlay RSI, highlight zones, and identify divergences with customizable settings.
지표
AI
Grid
+17
Clean 3D, Sleek Candles for Trend Patterns.
지표
ATR
EMA
+4
The FULL-MARKET-VIEW-DASHBOARD is a professional-grade trading suite for cTrader that eliminates market noise.
지표
ATR
RSI
+3
🚀 Specialized algorithm is designed to confirm entry and exit points with precision 🎯

가격