

설명
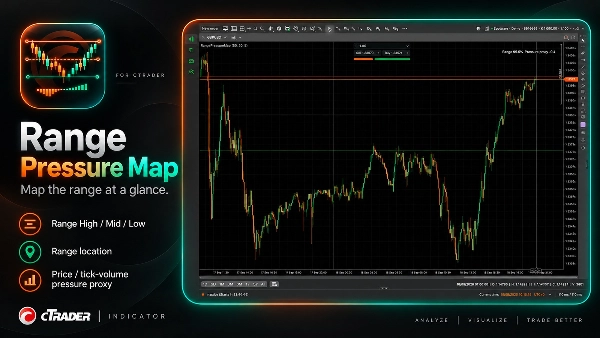
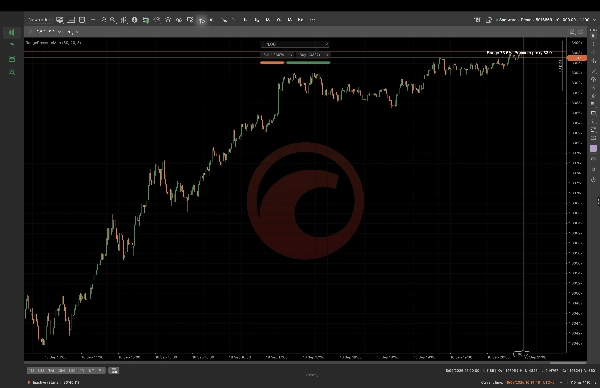
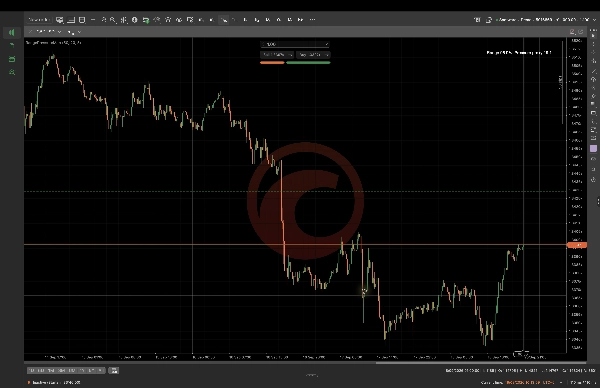
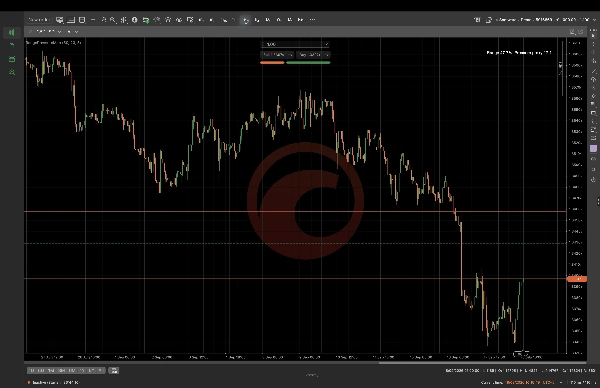
Range Pressure Map는 조회 범위를 계산하고 현재 가격 위치 및 결정론적 틱-볼륨 압력 프록시와 함께 Range High, Range Mid 및 Range Low를 표시합니다. 검토 중인 차트 컨텍스트에 맞게 범위 조회, 압력 조회 및 EMA 길이를 구성하세요. 이는 재량적 차트 분석을 위해 설계되었으며 주문 흐름, 실제 시장 거래량, 매수자 또는 매도자 활동, 예측 또는 자동 거래 실행을 나타내지 않습니다. 값은 선택한 심볼, 시간 프레임, 매개변수 및 사용 가능한 데이터에 따라 달라집니다.
요약
AI summary
Range Pressure Map is a cTrader indicator that calculates a lookback range and visually displays the Range High, Range Mid, and Range Low levels on your chart. It also shows the current price location within this range alongside a deterministic tick-volume pressure proxy, which serves as an estimate of market pressure based on tick volume data. Users can customize parameters including range lookback period, pressure lookback, and EMA length to align with their specific chart context. This tool is intended for discretionary chart analysis and does not provide order flow data, real market volume, buyer or seller activity, predictive signals, or automated trade execution. Its outputs depend on the selected trading symbol, timeframe, and input parameters. The indicator supports visualization of support and resistance levels combined with volume-based pressure insights to assist traders in analyzing price action within defined ranges.
지표 프로필
지표 카테고리
지지 및 저항
출력 유형
시각화
데이터 요구 사항
막대만
고객 리뷰
0.0
리뷰: 0
고객 리뷰
이 상품에 대한 리뷰가 아직 없습니다. 이미 사용해 보셨나요? 다른 사람들에게 가장 먼저 소개해 주세요!
상담
자주 묻는 질문(FAQ)
EMA
Volume
트레이딩 봇, 지표, 플러그인 등 cTrader Store에서 제공되는 상품은 제3자 개발자에 의해 제공되며, 이는 단순히 정보 및 기술적 접근을 목적으로 제공된 것입니다. cTrader Store는 중개인이 아니며, 투자 조언, 개인별 추천 또는 향후 성과에 대한 어떠한 보장도 제공하지 않습니다.
이 작성자의 상품 더 보기




!["[Hamster-Coder] Pivot Points MTF" 로고](https://cdn.ctrader.com/image/webp/4c143e5a-309c-40e3-a578-f04d1e133ffa_31159)















가격
가입일 16/09/2026