Descrizione
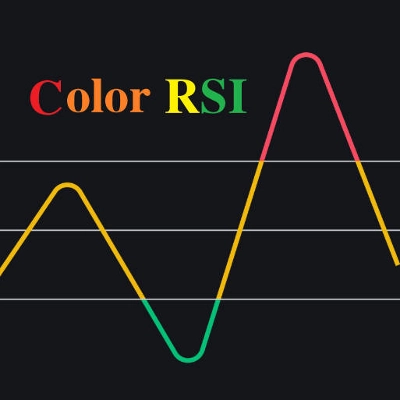
Questo è un super indicatore che integra l'indicatore RSI con un sistema a doppia media mobile. L'intensità dell'RSI è rappresentata da quattro colori: rosso (>70) > arancione (>50) > giallo (>30) > verde. Le doppie medie mobili utilizzano EMA con parametri predefiniti impostati a 48/144, che possono essere personalizzati in base alle tue esigenze.
Come usare:
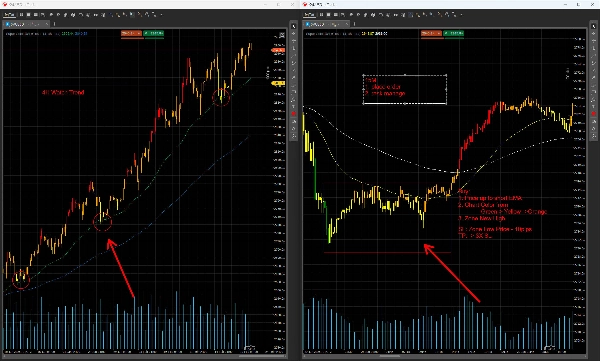
Quando usato in combinazione con più timeframe (es. 4H→15M; 1H→5M, illustrato qui usando 4H→15M come esempio):
- Identificazione del trend tramite doppie EMA (timeframe 4H):
-
- Trend rialzista: 48EMA sopra 144EMA.
- Trend ribassista: 48EMA sotto 144EMA.
- Consolidamento laterale: Le due EMA sono intrecciate.
- Punti di ingresso/uscita sul timeframe 15M:
-
- Setup di acquisto (trend rialzista):
-
- Il prezzo ritraccia verso la 48EMA sul grafico 4H.
- Passa a 15M: Entra quando il prezzo rompe al di sopra dell'area di consolidamento a 15M.
- Stop loss: Impostalo al recente massimo oscillante +10 pips .
- Setup di vendita (trend ribassista):
-
- Il prezzo ritraccia verso la 48EMA sul grafico 4H.
- Passa a 15M: Entra quando il prezzo rompe al di sotto dell'area di consolidamento a 15M.
- Stop loss: Impostalo al recente minimo oscillante –10 pips .
- Segnali di divergenza del prezzo:
-
- Divergenza ribassista (massimo):
-
- Il prezzo fa un nuovo massimo (in ritracciamento), ma il colore RSI cambia da rosso (RSI >70) a arancione (RSI >50) .
- Divergenza rialzista (minimo):
-
- Il prezzo fa un nuovo minimo (in ritracciamento), ma il colore RSI cambia da verde (RSI ≤30) a giallo (RSI ≤50) .
Avvertenza sul rischio:
Nessun indicatore è adatto a tutte le condizioni di mercato. Testa questa strategia accuratamente in un ambiente demo prima di applicarla al trading reale. Un uso improprio può portare a perdite significative.
Riepilogo
Profilo indicatore
Recensioni dei clienti
0.0
Recensioni: 0
Recensioni dei clienti
Questo prodotto non ha ancora ricevuto recensioni. L'hai già provato? Fallo sapere agli altri per primo!
Discussioni
Domande frequenti
Prop
Forex
Indices
Commodities
RSI
Crypto
Stocks
I prodotti disponibili tramite cTrader Store, inclusi bot di trading, indicatori e plugin, sono forniti da sviluppatori terzi e resi disponibili esclusivamente a scopo informativo e di accesso tecnico. cTrader Store non è un broker e non fornisce consulenze in materia di investimento, raccomandazioni individualizzate o garanzie di risultati futuri.


Prezzo
Da 30/09/2024
44
Vendite