
설명
평균 캔들 시간 오실레이터 (ACTO)
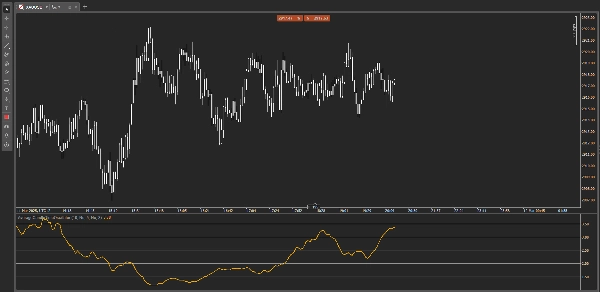
차트 캔들의 평균 지속 시간을 분석하는 고급 오실레이터인 ACTO로 거래 성과를 향상시키고 변동성과 시장 활동 변화를 빠르게 식별하세요.
왜 ACTO를 선택해야 하나요?
- 정확한 캔들 시간 측정: 느리거나 빠른 시장 상황을 쉽게 감지하여 진입과 청산을 최적화할 수 있습니다.
- 사용자 정의 임계값: 특정 임계값을 설정하여 중요한 순간을 강조하고 시장 리듬 변화에 신속하게 대응할 수 있습니다.
- 자동 알림: 평균 캔들 지속 시간이 설정한 임계값을 초과할 때 즉시 알림을 받아 중요한 거래 기회를 놓치지 않습니다.
- 사용자 친화적 인터페이스: 모든 수준의 트레이더에게 적합한 간단하고 직관적인 표시.
스캘핑, 데이 트레이딩, 단기 타임프레임 거래에 완벽한 ACTO는 시장 타이밍 역학에 기반한 중요한 시장 움직임을 예측하려는 모든 트레이더에게 필수 도구입니다.
기타 지표
요약
지표 프로필
고객 리뷰
4.5
리뷰: 2
5 | 50 % | |
4 | 50 % | |
3 | 0 % | |
2 | 0 % | |
1 | 0 % |
고객 리뷰
March 19, 2025
The product earns time when it gives the trader a reason to pause. Demo first makes more sense.
March 15, 2025
Bad impulses show up less often in the notes, but the market context still matters.
상담
자주 묻는 질문(FAQ)
Scalping
트레이딩 봇, 지표, 플러그인 등 cTrader Store에서 제공되는 상품은 제3자 개발자에 의해 제공되며, 이는 단순히 정보 및 기술적 접근을 목적으로 제공된 것입니다. cTrader Store는 중개인이 아니며, 투자 조언, 개인별 추천 또는 향후 성과에 대한 어떠한 보장도 제공하지 않습니다.
이 작성자의 상품 더 보기

좋아하실 만한 다른 항목


가격
378.94M
거래량
1.9M
핍 수익