Descripción
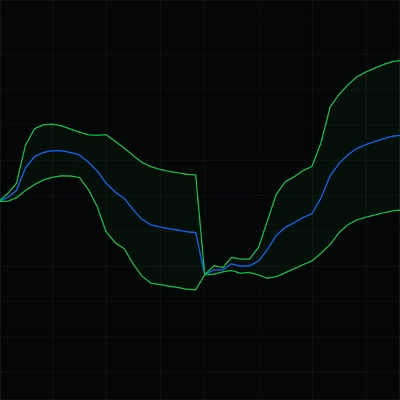
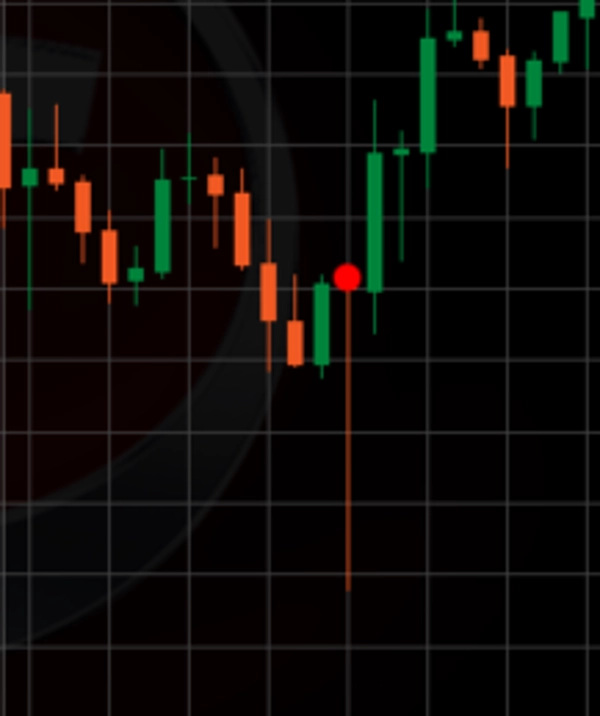
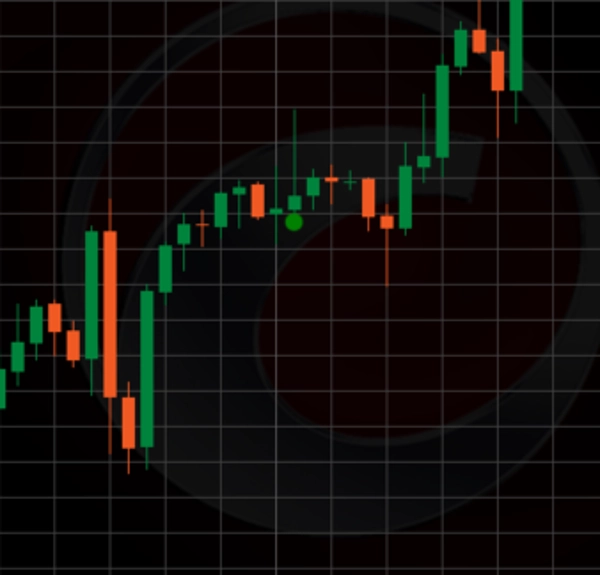
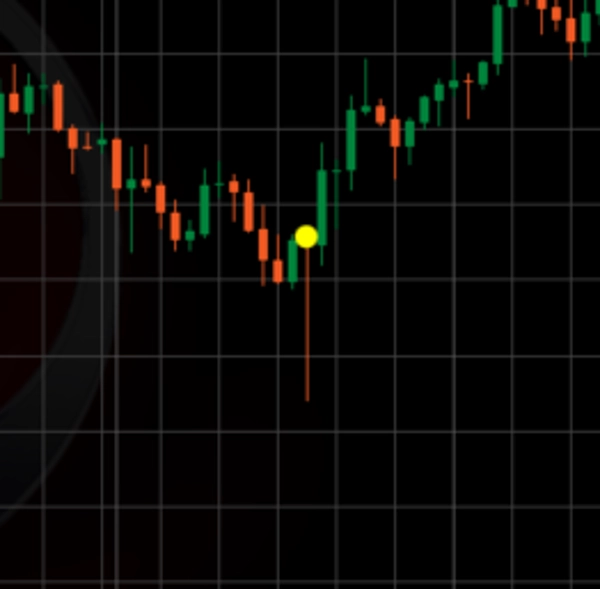
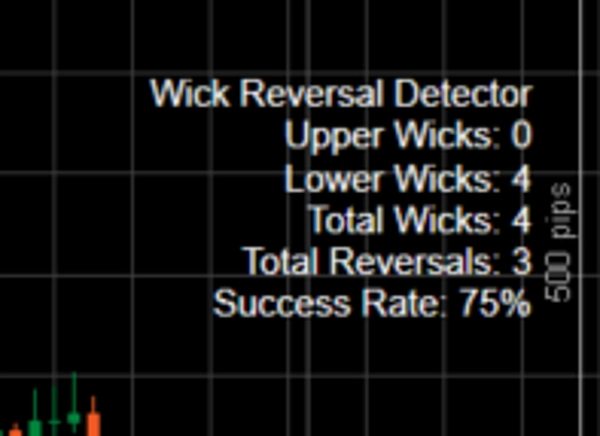
El indicador Long Wick es una poderosa herramienta de análisis técnico creada para cTrader que se centra en identificar velas con mechas inusualmente largas, ya sean superiores o inferiores, en relación con el tamaño de su cuerpo y el rango promedio de la vela. Resalta estas mechas en el gráfico como posibles puntos de reversión, donde el mercado puede haber rechazado precios más altos (para mechas superiores, sugiriendo una reversión bajista) o precios más bajos (para mechas inferiores, sugiriendo una reversión alcista). El indicador utiliza una combinación de un multiplicador de umbral de mecha, una relación mínima mecha-cuerpo y una media móvil simple (SMA) para filtrar la tendencia y eliminar el ruido, enfocándose en patrones significativos de rechazo de precios. Cada mecha detectada se marca con un círculo (verde para mechas superiores, rojo para mechas inferiores si se confirman como reversiones, o amarillo si no), y se muestran datos estadísticos (por ejemplo, total de mechas, reversiones y tasa de éxito) en el gráfico para facilitar el seguimiento.
Cómo usar en el trading:
- Identificación de oportunidades de reversión: Utilice el indicador para detectar mechas largas que ocurran en niveles clave de soporte o resistencia, o en contra de la tendencia predominante (por ejemplo, una mecha inferior larga en una tendencia bajista para una posible reversión alcista). Un círculo sólido verde o rojo indica una reversión confirmada basada en la acción del precio dentro del período de confirmación, lo que constituye una señal para considerar entrar en una operación en la dirección opuesta (por ejemplo, comprar en una reversión de mecha inferior roja, vender en una reversión de mecha superior verde).
- Confirmación con otras herramientas: Combine el indicador Long Wick con otros indicadores técnicos (por ejemplo, RSI, MACD o líneas de soporte/resistencia) para confirmar señales de reversión y evitar falsos positivos, especialmente en mercados volátiles.
- Gestión del riesgo: Coloque órdenes de stop-loss más allá del extremo de la mecha (por ejemplo, debajo del mínimo para una reversión alcista) para protegerse contra la posibilidad de que la reversión falle, y establezca niveles de toma de ganancias basados en soportes/resistencias cercanos o una relación riesgo-recompensa (por ejemplo, 1:2).
- Monitoreo de la tasa de éxito: Revise regularmente la tasa de éxito mostrada para evaluar la efectividad del indicador a lo largo del tiempo y ajuste su estrategia en consecuencia.
Ajuste de parámetros para un mejor uso:
- Período de retroceso (Predeterminado: 5): Determina el número de barras usadas para calcular el rango promedio de la vela. Un período más corto (por ejemplo, 3-10) hace que el indicador sea más sensible a la volatilidad reciente, ideal para mercados de movimiento rápido, mientras que un período más largo (por ejemplo, 20-50) suaviza el promedio para condiciones de tendencia. Ajuste según su marco temporal (por ejemplo, menor para gráficos de 1 minuto, mayor para gráficos de 1 hora).
- Período de confirmación (Predeterminado: 15): Establece el número de barras para confirmar una reversión. Un período más corto (por ejemplo, 5-10) es adecuado para estrategias de scalping rápidas, mientras que un período más largo (por ejemplo, 15-30) es mejor para swing trading para capturar reversiones extendidas. Aumente si nota demasiadas marcas amarillas donde las reversiones ocurren más tarde.
- Multiplicador de umbral de mecha (Predeterminado: 1.3): Multiplica el rango promedio de la vela para establecer la longitud mínima de la mecha. Valores más bajos (por ejemplo, 1.0-1.5) detectan más mechas (útil en mercados de baja volatilidad), mientras que valores más altos (por ejemplo, 2.0-3.0) filtran solo las mechas más significativas (mejor en mercados de alta volatilidad). Ajuste para equilibrar sensibilidad y calidad de la señal.
- Período de tendencia (SMA) (Predeterminado: 21): Define la longitud de la SMA para el filtrado de tendencia. Un período más corto (por ejemplo, 10-20) responde a tendencias a corto plazo, mientras que un período más largo (por ejemplo, 50-100) se alinea con tendencias a largo plazo. Ajuste para que coincida con su horizonte de trading y condiciones del mercado.
- Relación mínima mecha-cuerpo (Predeterminado: 3): Establece la relación mínima entre la longitud de la mecha y el tamaño del cuerpo. Una relación más baja (por ejemplo, 2-3) incluye más velas con mechas moderadas, mientras que una relación más alta (por ejemplo, 4-5) se enfoca en velas con mechas muy pronunciadas. Aumente para señales de reversión más estrictas, disminuya para más oportunidades.
- Tolerancia de reversión (pips) (Predeterminado: 5): Permite una tolerancia en pips para que el precio se extienda más allá del extremo de la mecha antes de descalificar una reversión. Un valor menor (por ejemplo, 2-3) asegura una confirmación estricta de reversión, mientras que un valor mayor (por ejemplo, 5-10) acomoda retrocesos menores. Ajuste según el valor del pip y la volatilidad del símbolo.
Consejos de optimización:
- Comience con la configuración predeterminada y realice pruebas retrospectivas con datos históricos para su instrumento y marco temporal preferidos.
- En mercados con tendencia, aumente el multiplicador de umbral de mecha y la relación mínima mecha-cuerpo para enfocarse en señales de reversión más fuertes.
- En mercados laterales, disminuya estos parámetros para capturar más mechas, pero combínelos con un período de confirmación más corto para evitar descalificaciones tardías.
- Revise regularmente la tasa de éxito y ajuste los parámetros si cae por debajo de su umbral aceptable (por ejemplo, 70%).
Al personalizar estos parámetros, los traders pueden adaptar el indicador Long Wick a su estrategia específica, mejorando su efectividad para detectar puntos de reversión con alta probabilidad en diversas condiciones de mercado.
Resumen
Traders can use the indicator to spot reversal opportunities at key support or resistance levels or against prevailing trends. It is recommended to confirm signals with other technical tools such as RSI or MACD and to apply risk management by placing stop-loss orders beyond wick extremes. The indicator’s parameters—including lookback and lookforward periods, wick threshold multiplier, SMA trend period, minimum wick-to-body ratio, and reversal tolerance—are adjustable to suit different market conditions and trading styles. Regular review of the success rate helps optimize performance.
Valoraciones de clientes
5 | 0 % | |
4 | 100 % | |
3 | 0 % | |
2 | 0 % | |
1 | 0 % |