
Penerangan
Pengenalan
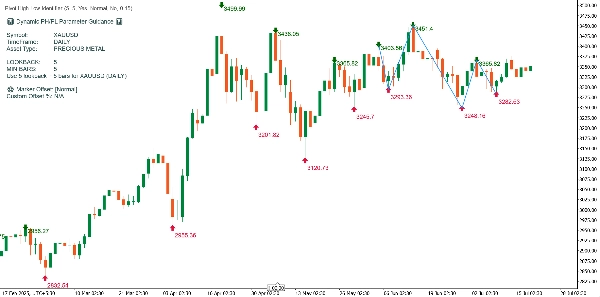
Carta yang dipaparkan menggunakan penunjuk cTrader tersuai "Visualisasi PH/PL yang Dipertingkatkan". Alat ini secara dinamik mengenal pasti titik ayunan penting tinggi dan rendah (PH/PL), melukis garis tren zigzag di antara mereka, dan menghasilkan panel panduan yang informatif berdasarkan simbol, jangka masa, dan jenis aset yang dikesan. Di bawah adalah pecahan terperinci bagaimana penunjuk memproses dan memberi anotasi pada carta contoh.
Elemen Utama yang Diterangkan pada Carta
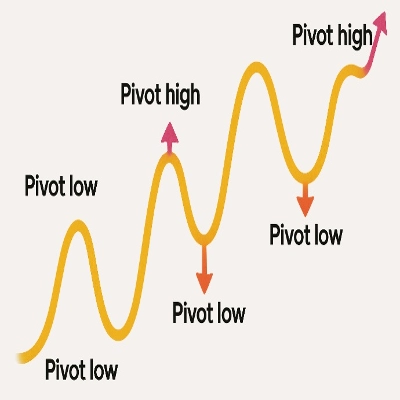
1. Pivot Highs (PH) dan Pivot Lows (PL)
- Pivot Highs: Ditandakan dengan anak panah hijau ke bawah dan harga tinggi masing-masing di atas bar.
- Pivot Lows: Ditandakan dengan anak panah merah ke atas dan harga rendah masing-masing di bawah bar.
- Logik Digunakan: PH berlaku apabila harga tinggi bar lebih tinggi daripada harga tinggi 'lookback' bar sebelum dan selepasnya; PL ditakrifkan secara serupa untuk harga rendah.
- Konfigurasi Lookback: Dalam kod dan carta anda, lookback sebanyak 5 digunakan, menghasilkan pengesanan ayunan yang kukuh sesuai untuk data harian.
2. Label Harga
- Paparan Boleh Alih: Label harga yang dipasang pada setiap penanda PH/PL boleh dipaparkan atau disembunyikan melalui parameter penunjuk. Dalam contoh ini, harga dipaparkan untuk kejelasan.
- Pelarasan Auto Offset: Penempatan label disesuaikan secara algoritma menggunakan jarak optimum (pra-tetap atau tersuai), memastikan teks tidak bertindih dengan lilin atau elemen carta.
3. Garis Tren Zigzag Dinamik
- Visualisasi: Garis zigzag biru menghubungkan titik PH/PL terkini dan penting, menonjolkan urutan ayunan harga utama.
- Tujuan: Ini membantu pedagang menjejaki perubahan tren dan peralihan momentum secara visual sepanjang tempoh carta.
4. Panel Panduan Dinamik
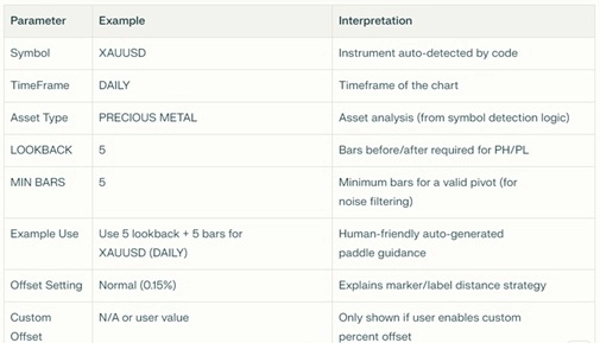
Panel carta kiri atas meringkaskan tetapan utama, hasil pengesanan, dan cadangan penggunaan
Bagaimana Penunjuk Berfungsi pada Carta Ini
Penjelasan Bertahap:
- Pengenalpastian Ayunan:
Penunjuk mengimbas setiap bar harian selepas inisialisasi, membandingkan harga tinggi dan rendah dalam tetingkap lima bar di setiap sisi untuk mengenal pasti PH dan PL. - Penempatan Penanda:
PH dan PL ditandakan menggunakan anak panah berwarna; label harga yang sepadan diletakkan pada jarak optimum untuk memastikan kejelasan. - Visualisasi Tren:
Algoritma memilih 10 pivot terkini (PH/PL, boleh dikonfigurasi) dan melukis garis biru yang menghubungkannya, memetakan ayunan pasaran utama dan membantu dalam pengenalan tren. - Panel Parameter:
Panel paparan mengesahkan pengesanan automatik jenis aset (di sini: XAUUSD, "LOGAM BERHARGA") dan menyediakan nilai yang disyorkan secara optimum untuk lookback, bar minimum, dan offset untuk gabungan ini—semua dipaparkan secara ringkas. - Penyesuaian Aset Pintar:
Jika anda menggunakan penunjuk ini pada simbol lain (seperti forex eksotik, kripto, atau indeks saham), panel panduan dan logik pengesanan akan menyesuaikan secara automatik, menetapkan lookback dan bar minimum yang disyorkan untuk tingkah laku pasaran dan jangka masa tertentu itu. - Pengalaman Carta Bersih:
Semua objek grafik yang dilukis (anak panah, garis tren, label harga, teks statik) dibersihkan dan dilukis semula setiap pengiraan untuk mengelakkan kekacauan. Penunjuk sentiasa meletakkan maklumatnya di atas carta harga, tidak pernah di panel berasingan.
Pengajaran Praktikal untuk Perdagangan
- Pengenalan Struktur Ayunan: Anda boleh membaca dengan cepat urutan dan magnitud ayunan pasaran.
- Perancangan Masuk/Keluar: Putaran PH/PL boleh digunakan untuk logik hentian susulan atau menjangka titik pembalikan yang berpotensi.
- Penggunaan Universal: Tidak kira aset atau jangka masa, penunjuk menyesuaikan sendiri dan menerangkan cadangannya.
- Visual Profesional yang Jelas: Kekacauan harga dan pertindihan label diminimumkan kerana offset pintar.
Ringkasan
Carta ini menunjukkan kuasa dan kejelasan Visualisasi PH/PL yang Dipertingkatkan. Penunjuk menyediakan petunjuk visual segera kepada pedagang mengenai titik pivot utama, arah dan saiz ayunan, serta panduan kontekstual khusus untuk instrumen dan jangka masa. Segalanya adalah automatik, terkini, dan boleh disesuaikan untuk mana-mana aset atau persekitaran pasaran.
Nota: Disebabkan had dalam cTrader, penunjuk menunjukkan pilihan untuk meletakkan penunjuk pada panel baru tetapi itu tidak akan digunakan kerana penunjuk tidak boleh dilihat dalam panel baru disebabkan saiz dan fungsinya. Juga, jika harga dicetak terlalu jauh dari anak panah pivot dan ia mengelirukan pengguna maka pengguna boleh memilih secara manual untuk memaparkan harga atau tidak.
Jika anda memerlukan penyesuaian lanjut, seperti isyarat bunyi/amaran pada pivot, atau penapisan dinamik untuk ayunan yang lebih kecil, beritahu sahaja!

















