

Penerangan
IDEA
RSI yang menterjemahkan tahapannya ke dalam harga dan melukisnya terus pada carta, mengekalkan momentum dan harga dalam ruang yang sama dan bukannya dalam panel berasingan.
MASALAH
RSI biasanya dibaca dalam panel berasingan.
Untuk menggunakannya, anda mesti sentiasa membandingkan nilai osilator dengan apa yang dilakukan harga pada carta utama.
Tahap seperti 70, 30, atau 50 adalah nombor pada osilator. Ia tidak memberitahu anda di mana harga perlu berada supaya RSI mencapainya.
Jadi anda terus menterjemah dengan mata: "RSI berada pada 62 — di mana itu pada carta?"
Masalahnya bukan pada RSI itu sendiri.
Masalahnya ialah momentum dan harga dipaparkan di dua tempat berbeza, dalam dua unit berbeza.
KONSEP TERAS: TAHAP RSI MENJADI TAHAP HARGA.
RSI tradisional bertanya:
"Apakah nilai RSI sekarang?"
RSI Overlay bertanya:
"Pada harga berapakah RSI akan mencapai tahap ini?"
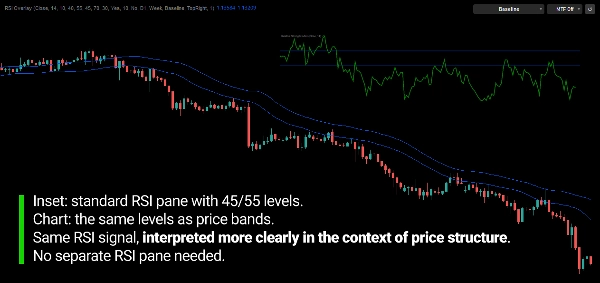
Setiap tahap RSI ditukar kepada tahap harga yang sepadan dan dilukis terus pada carta.
Osilator tidak lagi sesuatu yang anda baca dalam satu tetingkap dan terjemahkan ke tetingkap lain.
Maklumatnya dinyatakan dalam skala harga yang sama dengan pergerakan yang anda sedang analisis.
RSI menetapkan tahap. Carta menunjukkan ia dalam harga.
APA YANG DILAKUKANNYA
RSI Overlay menukar rujukan RSI terpilih kepada tahap harga dinamik dan memaparkannya terus pada carta utama.
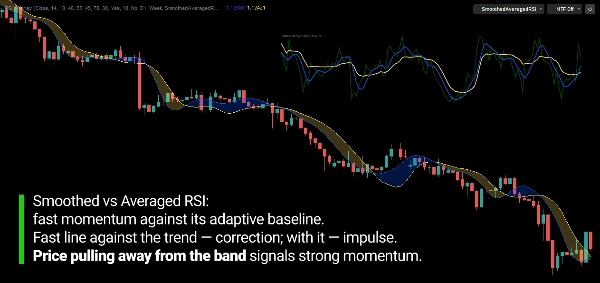
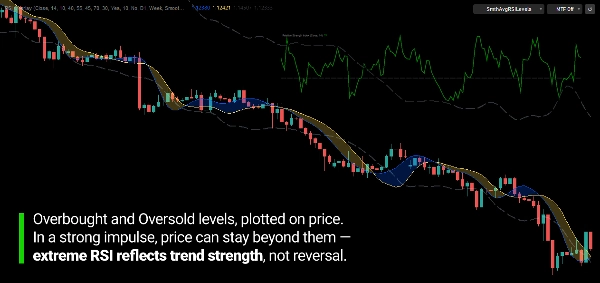
Garis Asas Bull dan Bear, tahap Overbought dan Oversold, dan dua rujukan berasaskan RSI, Smoothed RSI dan Averaged RSI, semuanya diwakili sebagai garis harga.
Garis-garis dikemas kini dengan setiap bar baru, jadi ia terus mencerminkan keadaan RSI terkini dan tidak kekal pada harga sejarah.
Ini bukan tahap sokongan atau rintangan konvensional.
Ia mewakili harga di mana nilai RSI yang sepadan akan dicapai di bawah pengiraan RSI semasa.
Penunjuk ini tidak cuba meramalkan ke mana harga akan pergi.
Ia menunjukkan di mana harga berdiri berbanding tahap RSI yang anda perhatikan.
BAGAIMANA IA BERFUNGSI
- RSI dikira menggunakan pelicinan Wilder.
- Setiap tahap RSI ditukar kepada harga yang akan menghasilkan tahap tersebut.
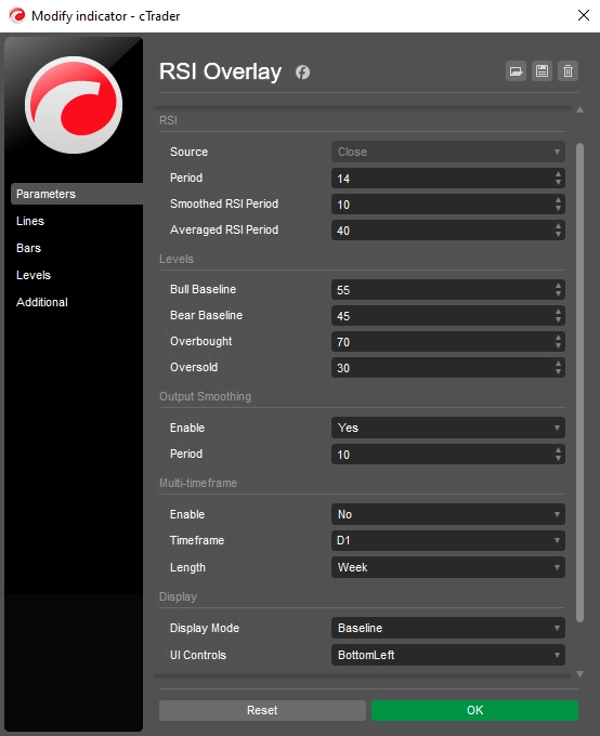
- Garis Asas Bull dan Bear menandakan zon momentum di sekitar garis tengah (lalai 55 / 45).
- Tahap Overbought dan Oversold ditukar dengan cara yang sama (lalai 70 / 30).
- Smoothed RSI dan Averaged RSI juga ditukar menjadi garis harga.
RUJUKAN RSI
Garis Asas Bull / Bear
Tahap harga di mana RSI akan memasuki wilayah momentum bullish atau bearish. Ruang di antara mereka menunjukkan di mana momentum adalah neutral.
Smoothed RSI
Versi RSI yang dikurangkan hingar, dipaparkan sebagai garis harga yang bertindak balas dengan lebih lancar.
Averaged RSI
Purata RSI yang lebih perlahan dan adaptif, dipaparkan sebagai garis harga. Ia menyediakan rujukan momentum yang lebih stabil.
Overbought / Oversold
Tahap harga di mana RSI akan mencapai ambang overbought dan oversold.
Rujukan ini bukan isyarat automatik.
Posisi mereka berbanding harga, dan antara satu sama lain, memberikan konteks tentang bagaimana momentum berkembang.
KONTEKS MULTI-TIMEFRAME
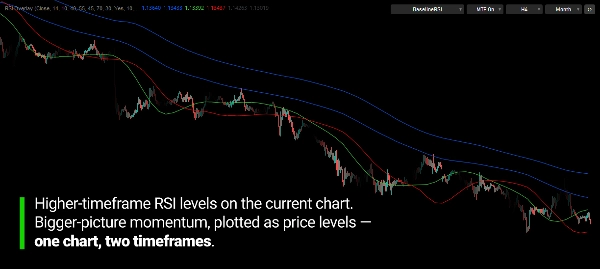
RSI tidak perlu datang dari jangka masa carta yang anda lihat.
Sebagai contoh, RSI Mingguan atau Bulanan boleh diproyeksikan ke carta H1.
Ini meletakkan rangka kerja momentum jangka masa lebih tinggi terus pada tindakan harga yang anda tonton.
Anda memilih berapa banyak sejarah yang dilukis, dari sejam terakhir hingga beberapa tahun.
Jangka masa yang dipilih mesti lebih tinggi daripada jangka masa carta.
KAWAL DARIPADA CARTA
Sebelas mod paparan membolehkan anda menunjukkan hanya apa yang anda perlukan, dari sepasang garis asas yang bersih hingga set penuh rujukan RSI.
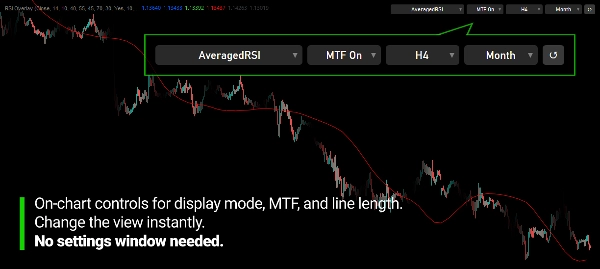
Bar kawalan padat pada carta membolehkan anda menukar mod paparan, menghidupkan atau mematikan multi-timeframe, dan menukar jangka masa serta panjang tanpa membuka semula tetapan.
Butang reset mengembalikan semuanya ke parameter permulaan anda.
Bar boleh diletakkan di mana-mana sudut atau disembunyikan.
APA YANG ANDA BOLEH PERHATIKAN
Penunjuk ini direka untuk menjadikan beberapa perkara kelihatan:
- Di mana harga berdiri berbanding zon momentum bullish dan bearish
- Sejauh mana harga dari tahap overbought dan oversold, dalam istilah harga
- Perubahan momentum di sekitar garis asas
- Tarikan balik dan kesinambungan berbanding RSI yang dilicinkan dan purata
- Konteks momentum jangka masa lebih tinggi pada carta jangka masa lebih rendah
RSI Overlay adalah alat pengukuran, bukan sistem beli/jual berdiri sendiri.
DIBUAT UNTUK MOMENTUM DALAM ISTILAH HARGA
Tujuannya bukan untuk menggantikan RSI.
Ia adalah untuk menghilangkan keperluan menterjemah osilator kembali ke harga dengan mata.
Segala yang anda tahu tentang RSI masih terpakai. Ia hanya dipaparkan di mana keputusan sebenarnya dibuat: pada carta harga.
CIRI UTAMA
- Tahap RSI ditukar menjadi tahap harga pada carta utama
- Garis Asas Bull dan Bear (lalai 55 / 45)
- Tahap harga Overbought dan Oversold (lalai 70 / 30)
- Garis RSI yang dilicinkan
- Garis RSI yang dipurata
- RSI multi-jangka masa pada carta jangka masa lebih rendah
- Panjang paparan boleh dipilih untuk garis multi-jangka masa
- 11 mod paparan
- Bar kawalan pada carta dengan butang reset
- Sumber boleh dikonfigurasikan, tempoh RSI, pelicinan dan purata
- Warna, gaya garis dan ketebalan boleh disesuaikan
---
Perdagangan melibatkan risiko. Penunjuk ini adalah alat analisis teknikal dan harus digunakan bersama dengan pengurusan risiko yang sesuai.
Ringkasan
It supports multi-timeframe analysis by allowing RSI data from higher timeframes (e.g., weekly or monthly) to be displayed on lower timeframe charts, providing broader momentum context. Users can customize display modes, line styles, colors, and control parameters directly from an on-chart control bar, which includes options to reset settings and adjust timeframe and length without reopening menus.
RSI Overlay serves as a measurement tool to visualize where price stands relative to momentum zones and RSI thresholds in price terms. It does not generate automatic trading signals but aids in observing momentum shifts, pullbacks, and continuations aligned with RSI levels on the price chart.
Ulasan pelanggan
5 | 100 % | |
4 | 0 % | |
3 | 0 % | |
2 | 0 % | |
1 | 0 % |
Perbincangan
Soalan Lazim























Harga
