
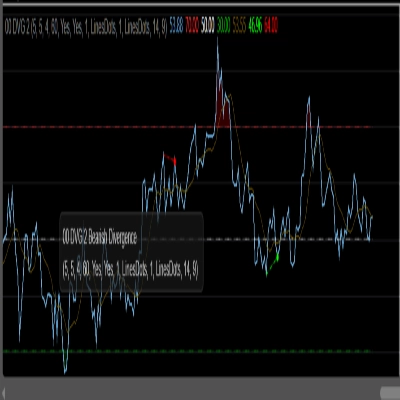
TradingView RSI DIVERGENCE
Indicador
Versión 1.0, Aug 2025
Windows, Mac
Desde 10/03/2025
13.67M
Volumen operado
24.66K
Pips ganados
Descripción
Remake RSI, puede darte el mismo mensaje de divergencia 99% que TV (No es un producto de TV, solo el nombre)
Resumen
AI summary
TradingView RSI DIVERGENCE is an indicator designed to replicate the Relative Strength Index (RSI) divergence signals similar to those found on TradingView. It provides divergence messages with approximately 99% similarity to TradingView's alerts, assisting traders in identifying potential trend reversals or momentum shifts based on RSI divergence. This tool focuses solely on generating divergence signals and does not include other trading functionalities or position management features.
Perfil del indicador
Valoraciones de clientes
0.0
Valoraciones: 0
Valoraciones de clientes
Este producto todavía no se ha valorado. ¿Ya lo ha probado? Sea el primero en informar a otros.
Conversación
Preguntas frecuentes
Los productos disponibles a través de cTrader Store, incluidos bots, indicadores y plugins para operar, son proporcionados por desarrolladores de terceros y están disponibles únicamente con fines informativos y de acceso técnico. cTrader Store no es un bróker, por lo que no proporciona asesoramiento de inversión, recomendaciones personales ni ninguna garantía de rentabilidad futura.


















Precio
Desde 10/03/2025
13.67M
Volumen operado
24.66K
Pips ganados