
Daily TPO profile
Indikator
213 muat turun
Versi 1.0, Nov 2025
Windows, Mac
Penerangan
Profil TPO Harian
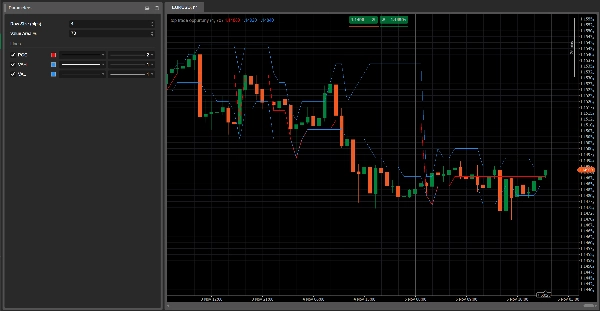
Penunjuk profil TPO harian yang mengira POC, VAH dan VAL untuk setiap sesi.
Melakar Titik Kawalan dan Kawasan Nilai 70% terus pada carta, membantu anda mengenal pasti zon nilai adil, tahap sokongan/rintangan utama dan kawasan potensi penolakan atau penerimaan harga.
Bagaimana ia berfungsi
Penunjuk ini membina profil TPO (Peluang Harga Masa) harian, serupa dengan Profil Pasaran.
Untuk setiap bar hari dagangan, ia:
- membahagikan paksi harga kepada “langkah” tetap yang ditakrifkan oleh “Saiz Baris (pips)”
- untuk setiap langkah harga, mengira berapa banyak bar yang menyentuh tahap itu (TPO = berapa kali harga didagangkan di situ)
- pada akhir hari ia mengira:
-
- POC (Titik Kawalan) → tahap harga dengan bilangan TPO tertinggi (di mana pasaran menghabiskan masa paling lama)
- VAH (Nilai Kawasan Tinggi) dan VAL (Nilai Kawasan Rendah) → tahap harga yang mengandungi kira-kira Peratus Kawasan Nilai (lalai 70%) daripada semua TPO untuk sesi tersebut
Penunjuk ini melakar tiga garis mendatar pada carta:
- Garis Merah → POC
- Garis Biru → VAH (atas) dan VAL (bawah)
Garis-garis ini dikemas kini bar demi bar sepanjang sesi dan diset semula apabila hari dagangan baru bermula.
Parameter utama
Saiz Baris (pips)
Menentukan ketebalan setiap langkah harga dalam profil.-
- Nilai lebih kecil = profil lebih terperinci
- Nilai lebih besar = profil lebih lancar
Peratus Kawasan Nilai
Peratusan jumlah TPO yang terkandung dalam Kawasan Nilai (biasanya 70%).
Kawasan Nilai adalah zon harga di mana kebanyakan aktiviti pasaran berlaku sepanjang hari.
Cara membacanya
- POC (garis merah)
-
- Tahap harga yang paling “diterima” oleh pasaran pada hari itu.
- Sering bertindak sebagai tahap keseimbangan: harga mungkin memantul, berhenti atau pecah dengan kuat di sekitar zon ini.
- Kawasan Nilai (VAH–VAL, garis biru)
-
- Mewakili zon “nilai adil” di mana kebanyakan dagangan berlaku.
- Tindakan harga berbanding VAH/VAL boleh menunjukkan:
-
- Penolakan harga ekstrem (pecahan palsu melebihi VAH/VAL)
- Penerimaan harga baru (pengukuhan di luar Kawasan Nilai)
Idea penggunaan tipikal
- Harga menolak VAL dan bergerak kembali ke dalam Kawasan Nilai → idea panjang berpotensi, bertaruh pada kembali ke “nilai adil” (pembalikan purata).
- Harga pecah di atas VAH dengan kekuatan dan mula membina struktur di atas → permulaan berpotensi kawasan nilai lebih tinggi baru (senario mengikuti tren).
- Beberapa hari dengan POC di sekitar tahap yang sama → zon keseimbangan/pengumpulan kuat, sering menjadi sokongan/rintangan utama.
Ringkasan
Ringkasan AI
The Daily TPO Profile indicator constructs a daily Time Price Opportunity (TPO) profile similar to a Market Profile, analyzing market activity by price levels throughout each trading session. It divides the price axis into fixed increments ("Row Size" in pips) and counts how many bars traded at each price step, representing TPOs. At the end of the session, it calculates three key levels: the Point of Control (POC), where the market spent the most time; the Value Area High (VAH); and the Value Area Low (VAL), which together define the price range containing approximately 70% of the trading activity.
The indicator plots these levels as horizontal lines on the chart—POC in red, VAH and VAL in blue—updating them bar by bar during the session and resetting daily. Traders use the POC as an equilibrium price level that may act as support or resistance. The Value Area highlights fair value zones, with price action near VAH and VAL signaling potential rejection or acceptance of price extremes. Typical applications include identifying mean reversion opportunities when price rejects VAL or trend-following setups when price breaks above VAH.
Main adjustable parameters include Row Size (pips), controlling profile detail, and Value Area %, defining the percentage of TPOs included in the value area. The indicator supports analysis across various markets including forex, indices, commodities, stocks, and cryptocurrencies.
Profil indikator
Ulasan pelanggan
0.0
Ulasan: 0
Ulasan pelanggan
Belum ada ulasan untuk produk ini. Anda sudah mencuba produk tersebut? Jadilah yang pertama untuk berkongsi pendapat anda!
Perbincangan
Soalan Lazim
Signal
Indices
Commodities
GBPUSD
RSI
Bollinger
Fibonacci
Scalping
AI
XAUUSD
NAS100
MACD
BTCUSD
Forex
Breakout
EURUSD
NZDUSD
Martingale
Prop
ZigZag
Supertrend
Fair Value Gap
SMC
Crypto
Grid
Stocks
ATR
USDJPY
VWAP
Produk yang tersedia melalui cTrader Store, termasuk bot dagangan, indikator dan plugin, disediakan oleh pembangun pihak ketiga dan diberikan akses untuk tujuan maklumat dan teknikal sahaja. cTrader Store bukan broker dan tidak memberikan nasihat pelaburan, syor peribadi atau sebarang jaminan prestasi masa hadapan.


Harga
42.11M
Volum yang didagangkan
6.13M
Pip dimenangi
224
Jualan
8.41K
Pemasangan percuma