Penerangan
Keunggulan Berwajaran Isipadu: Peta Jalan Lengkap untuk Momentum cTrader
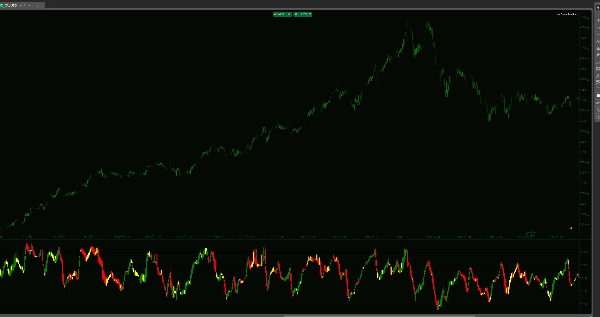
Penunjuk standard menunjukkan kepada anda di mana harga pernah berada. Penunjuk RSI Lilin Berwajaran Isipadu menunjukkan keyakinan di sebalik pergerakan itu. Dengan menggabungkan tindakan harga, isipadu tik, dan lima tahap institusi kritikal, alat ini mengubah RSI daripada osilator mudah menjadi sistem pemetaan trend yang komprehensif.
Daripada satu garis sahaja, anda mendapat lilin OHLC penuh dalam tetingkap penunjuk anda. Ini membolehkan anda melihat "struktur" momentum—menunjukkan sama ada pergerakan disokong oleh isipadu institusi yang berat atau hanya "pura-pura" kecairan rendah.
Strategi Pelaksanaan 5-Zon
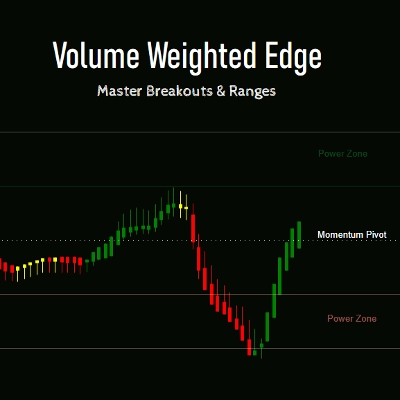
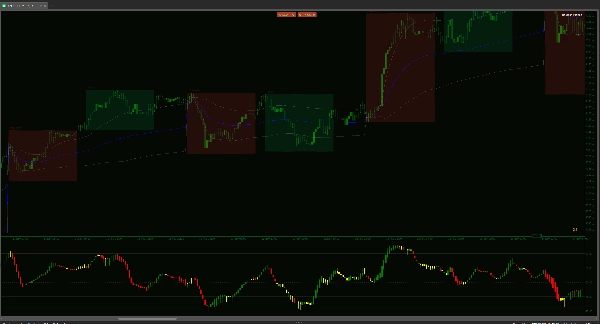
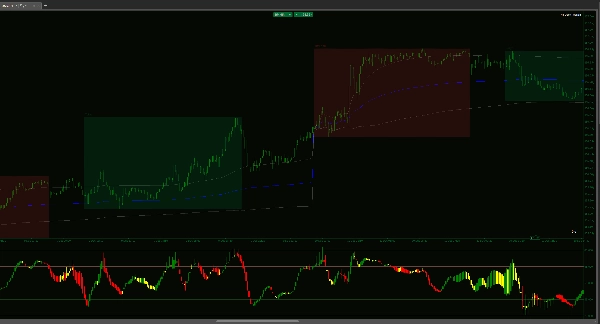
- Sambungan Kuasa (65–80 & 20–35): Ini adalah zon keyakinan tinggi. Apabila lilin berwajaran isipadu mengekalkan diri di sini, anda tidak mencari pembalikan—anda mengikuti trend. Di sinilah wang besar beroperasi, dan di mana pergerakan paling meletup berlaku.
- Koridor Scalping (50–65 & 35–50): Sesuai untuk sesi Asia atau pasaran terikat julat. Apabila trend jangka masa lebih tinggi adalah neutral, zon-zon ini menyediakan sasaran "pemulihan purata" berkemungkinan tinggi. Jika pasaran sedang berlegar, koridor ini membolehkan anda scalping putaran dengan ketepatan bedah.
- Pivot Momentum (50): Garis utama yang menentukan. Badan lilin berwajaran isipadu yang ditutup melintasi tahap ini adalah amaran pertama anda tentang perubahan struktur dalam kawalan pasaran.
Mengapa Alat Ini Mengubah Aliran Kerja Anda
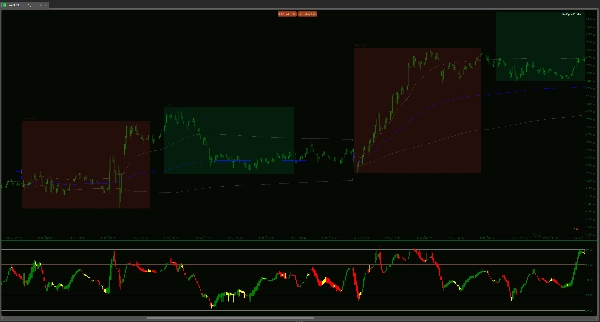
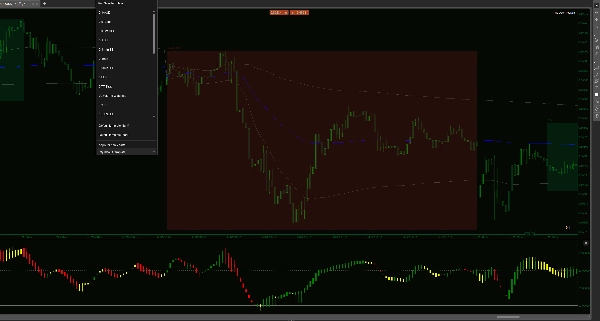
Kejelasan Berwajaran Isipadu: Setiap lilin dikira dengan mendarabkan perubahan harga dengan isipadu tik. Jika pergerakan berlaku pada isipadu nipis, lilin RSI tidak akan mengesahkannya. Ini mengelakkan anda daripada pergerakan "perangkap" yang kelihatan baik pada carta harga tetapi tiada sokongan.
Wawasan Badan Lilin: Garis RSI tradisional adalah gugup dan bergerigi. Lilin kami yang dilicinkan WMA menunjukkan kepada anda "buka" dan "tutup" momentum. Jika badan lilin RSI tebal dan padat, trend adalah sihat. Jika sumbu panjang, momentum sudah kehabisan tenaga.
Serbaguna Multi-Pasaran: * Trending: Gunakan julat 65–80 untuk kekal dalam dagangan menang lebih lama.
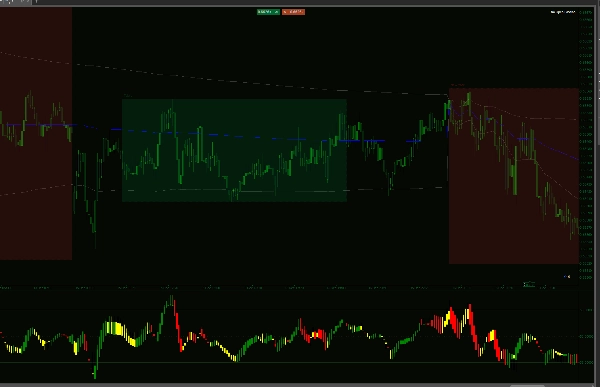
Berlegar/Scalping: Gunakan koridor 35–65 untuk menangkap putaran cepat semasa sesi volatiliti rendah seperti Asia.
Elakkan Perangkap "Barcode": Kebanyakan penunjuk memaksa anda meneka semasa tempoh volatiliti rendah. Penunjuk ini menampilkan kesan visual "Barcode" unik semasa konsolidasi. Apabila lilin mengecil, merata, dan menjadi neutral, penunjuk memberitahu anda bahawa "enjin pasaran" dimatikan. Amaran visual ini menyelamatkan anda daripada memasuki pura-pura isipadu rendah dan "dipotong" apabila tiada wang sebenar di belakang pergerakan harga.
Pengoptimuman Asli cTrader: Dibina khusus untuk API C# dengan logik "Max Visual Candles" untuk memastikan platform anda kekal responsif, walaupun pada carta 1-minit.
Berhenti berdagang berdasarkan ke mana pasaran mungkin pergi. Mula berdagang berdasarkan ke mana isipadu sebenarnya menolaknya. Penunjuk ini bukan sekadar tentang isyarat—ia tentang memahami tenaga dalaman pasaran.
Ringkasan
Ulasan pelanggan
5 | 33 % | |
4 | 67 % | |
3 | 0 % | |
2 | 0 % | |
1 | 0 % |


