
الوصف
ما الذي يفعله
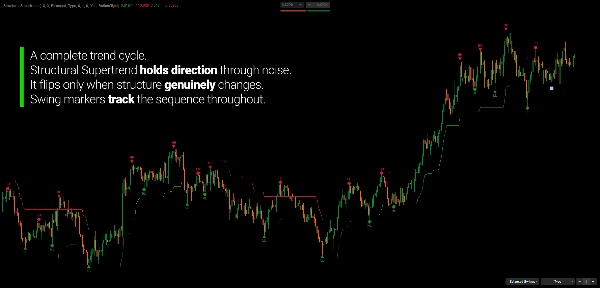
يتناول مؤشر السوبرتريند الهيكلي قيدًا أساسيًا في السوبرتريند الكلاسيكي: حيث يغير الاتجاه بمجرد إغلاق السعر خارج نطاقه.
في الاتجاهات النظيفة، يعمل ذلك بشكل جيد. في الظروف المتقلبة أو المتقطعة، يمكن لشمعة واحدة عدوانية أن تؤدي إلى تغيير الاتجاه — حتى عندما يظل الاتجاه الأوسع سليمًا هيكليًا. النتيجة هي تقلبات حادة، وخروج مبكر، وإعادة دخول بأسعار أسوأ.
هذا المؤشر مبني على فرضية مختلفة.
يتغير الاتجاه فقط عندما يؤكد السعر تحولًا هيكليًا حقيقيًا — وليس مجرد إغلاق لحظي يتجاوز حدًا معينًا. النتيجة هي تقليل الانعكاسات الخاطئة وتحقيق توافق أفضل مع كيفية تطور الاتجاهات فعليًا.
يصبح السوبرتريند هيكليًا. وتصبح الإشارات ذات معنى.
لماذا السوبرتريند الهيكلي؟
المشكلة
يتعامل السوبرتريند الأصلي مع كل إغلاق يتجاوز نطاقه على أنه انعكاس. هذا مقصود — فهو يجعل المؤشر تفاعليًا بطبيعته. لكن التفاعلية تأتي بتكلفة.
خلال مراحل التماسك، يغلق السعر كثيرًا خارج نطاق واحد ثم يعود فورًا. كل من هذه الحالات يولد إشارة تغيير، وكل تغيير يمثل قرار تداول محتمل، وكل منها يمثل خروجًا من مركز لم يكن من الضروري الخروج منه.
المتداولون الذين استخدموا السوبرتريند لفترة طويلة يعرفون هذا الإحباط جيدًا.
الحل
يمتد السوبرتريند الهيكلي النموذج الأصلي ليميز بين الإغلاقات الناتجة عن التقلبات والتغيرات الاتجاهية الحقيقية. يقوم بتصفية الضوضاء من خلال طلب تأكيد هيكلي قبل تغيير اتجاه الاتجاه.
تقلبات أقل. توافق أفضل مع الاتجاه. أقل تفاعلية مع الشموع الفردية.
لماذا الاحتفاظ بكليهما؟
لا يزال السوبرتريند الأصلي يظهر على الرسم البياني — ولكن فقط حيث يختلف عن الهيكلي. هذا التصميم مقصود.
- الهيكلي يتتبع اتجاه الاتجاه الرئيسي
- الأصلي يكشف عن سلوك الاندفاع والتصحيح داخل ذلك الاتجاه
عندما يتفق الاثنان: قناعة اتجاهية قوية. عندما يختلفان: من المحتمل أن تكون الحركة تصحيحية، وليست انعكاسًا حقيقيًا. تعطي هذه النظرة ذات الطبقتين سياقًا لا يوفره أي خط بمفرده.
كشف التأرجح المتكامل
يتضمن السوبرتريند الهيكلي إطار عمل كامل لكشف التأرجحات ومستويات الدعم/المقاومة — ليس كميزة ثانوية، بل كامتداد مباشر للتحليل الهيكلي.
يتم تحديد التأرجحات من خلال عملية تأهيل تركز على الهيكل أولاً: يتم تقييم كل مرشح بناءً على الإزاحة، تأكيد الحجم، والمسافة النسبية لـ ATR قبل قبوله. هذا يحافظ على تركيز خريطة التأرجح على نقاط التحول المهمة بدلاً من كل أقصى محلي.
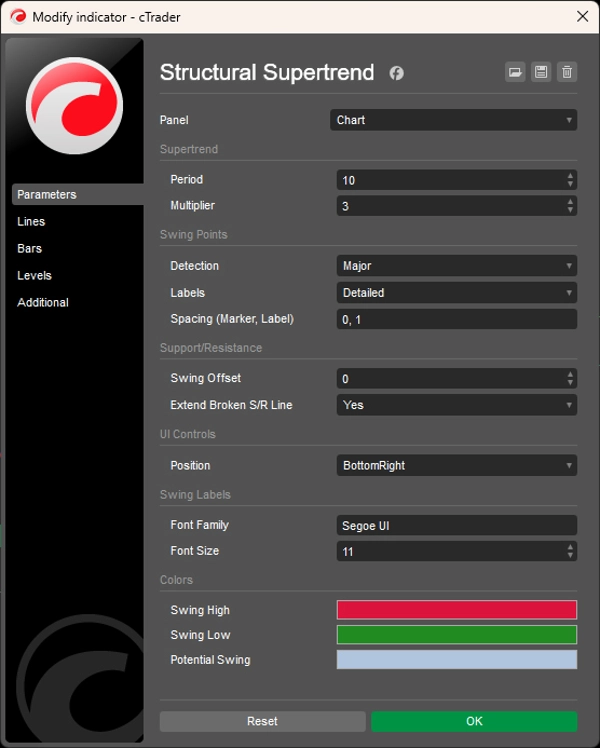
ثلاثة أوضاع للكشف
- صغير — حساسية متزايدة، يلتقط التأرجحات الداخلية داخل الاتجاهات
- متوازن — دقة مصفاة، الأفضل لمعظم حالات الاستخدام
- كبير — أقوى نقاط التحول الهيكلية فقط، مؤكدة بمعايير أوسع
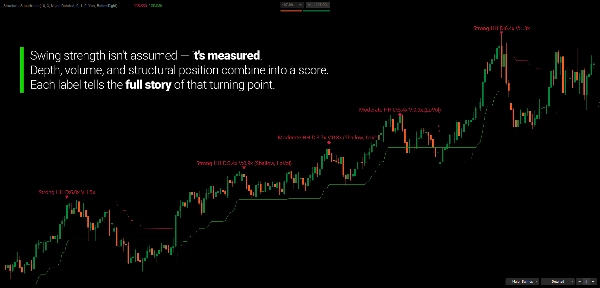
تصنيف قوة التأرجح
يتم تقييم كل تأرجح مؤكد حسب العمق، الحجم، والموقع الهيكلي نسبةً إلى التأرجح السابق من نفس النوع. يتم تصنيف القوة ديناميكيًا باستخدام ترتيب النسبة المئوية عبر تاريخ التأرجحات الأخيرة — وليس عبر حدود ثابتة. تعكس العلامات البصرية التصنيف: مثلثات للقوي، معينيات للمعتدل، دوائر للضعيف.
مناطق الدعم/المقاومة مع تتبع القطبية
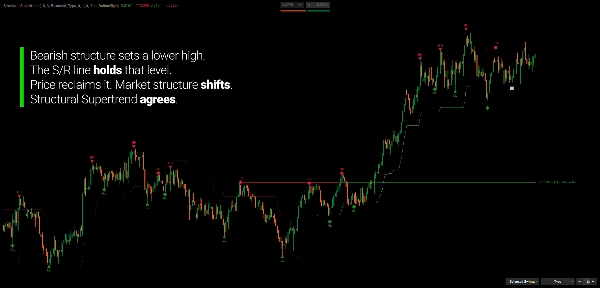
تصبح التأرجحات المؤكدة مستويات دعم/مقاومة نشطة تتتبع تاريخ تفاعلها الخاص. عندما يعيد السعر زيارة مستوى، يسجل المؤشر ما إذا كان الاتصال رفضًا بالفتيل أو كسرًا بالجسم. عندما يتم اجتياز مستوى ويغلق السعر خارجه، تنعكس القطبية — حيث يصبح المقاومة السابقة دعمًا، والعكس صحيح. إذا تم اجتيازه مرة أخرى، يتم إبطال المنطقة.
تُظهر تسميات العمر مدة نشاط كل مستوى وعدد مرات اختباره.
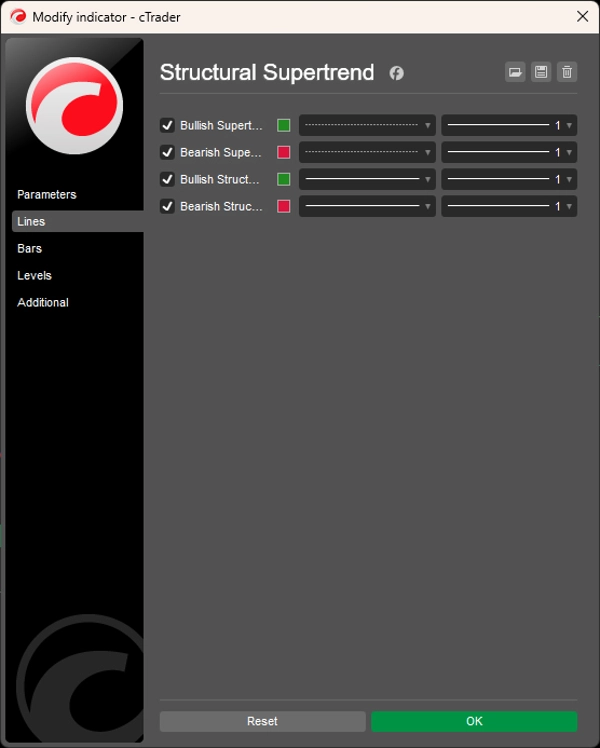
قراءة الرسم البياني
- خط الهيكل الأخضر: اتجاه هيكلي صاعد (دعم ديناميكي)
- خط الهيكل الأحمر: اتجاه هيكلي هابط (مقاومة ديناميكية)
- خط منقط: السوبرتريند الأصلي — يظهر فقط حيث يختلف عن الهيكلي
- خطوط الدعم/المقاومة: مستويات نشطة مع حالة القطبية والعمر
فحص توافق الاتجاه:
- اتفاق الهيكل + الأصلي → حركة اتجاهية ذات قناعة عالية
- اختلاف الهيكل + الأصلي → من المحتمل أن تكون مرحلة تصحيحية أو انتقالية
لمن هو هذا
هذا المؤشر مخصص للمتداولين الذين يرغبون في قراءة اتجاه الاتجاه وبنية السوق من إطار عمل واحد متماسك.
إذا كنت قد استخدمت السوبرتريند الكلاسيكي ووجدته تفاعليًا جدًا — يتغير كثيرًا خلال الظروف الجانبية — فقد تم بناء السوبرتريند الهيكلي لمعالجة ذلك بالضبط.
إنه مناسب جيدًا لـ متداولي الاتجاه والتأرجح الذين يريدون قراءة اتجاهية أنظف بدون انعكاسات خاطئة مستمرة، المتداولين القائمين على الهيكل الذين يتتبعون تسلسلات التأرجح للتحقق من صحة صحة الاتجاه، و المتداولين التقديريين الذين يستخدمون مستويات الدعم/المقاومة كسياق للدخول والخروج وإدارة المراكز.
تجعل أدوات واجهة المستخدم المدمجة من التطبيق عمليًا للاستخدام في الوقت الحقيقي: تبديل أوضاع الكشف، تعديل مراجع الدعم/المقاومة، وتبديل تفاصيل التسميات مباشرة على الرسم البياني — دون الحاجة لفتح لوحة الإعدادات.
هذا ليس مولد إشارات. إنه إطار تحليل هيكلي للمتداولين الذين يريدون فهم مكان السوق، وليس فقط ما يفعله الآن.
ما الذي يجعله مختلفًا
تعامل معظم تطبيقات السوبرتريند مع كل إغلاق يتجاوز النطاق على أنه قابل للتنفيذ. هذا المؤشر يعامله كمرشح — ويتطلب دليلًا هيكليًا قبل الالتزام بتغيير الاتجاه.
تحدد معظم كاشفات التأرجح القمم والقيعان المحلية دون معايير تقييم. هذا المؤشر يؤهل كل تأرجح بالإزاحة، الحجم، والموقع الهيكلي — ويقيم القوة ديناميكيًا مقابل تاريخ التأرجحات الأخيرة.
ترسم معظم أدوات الدعم/المقاومة خطًا وتتركه. هذا المؤشر يتتبع تاريخ التفاعل، ويشير إلى تغييرات القطبية، ويستمر في التطور مع إعادة السوق زيارة كل مستوى.
النتيجة: أداة للاتجاه والبنية تظل ذات صلة لفترة أطول، تتفاعل أقل مع الضوضاء، وتبني صورة أغنى لحالة السوق مع مرور الوقت.
---
فهم التحليل الهيكلي
بنية السوق ليست عن إيجاد "التأرجح الصحيح" أو "اتجاه الاتجاه الصحيح". إنها عن الحفاظ على صورة موضوعية لكيفية تطور تسلسلات السعر — وما إذا كان هذا التسلسل لا يزال متماسكًا أو بدأ في التدهور.
يُعرف الاتجاه ليس بحركة واحدة بل بسلسلة من العلاقات: قمم وقيعان أعلى في الاتجاهات الصاعدة، قمم وقيعان أدنى في الاتجاهات الهابطة. كل تأرجح جديد إما يؤكد أو يتحدى التسلسل الموجود. عندما يستمر التأكيد، تظل البنية سليمة. عندما تنكسر، تكون البنية في حالة انتقال.
ما يجعل التحليل الهيكلي مفيدًا ليس أنه يتنبأ بمكان ذهاب السعر، بل أنه يصف مكان السعر الحالي ضمن تسلسله الخاص. هذا التمييز مهم. التنبؤ يتطلب افتراضات حول المستقبل. الملاحظة الهيكلية تتطلب فقط قراءة دقيقة لما حدث بالفعل.
المؤشرات المبنية على المنطق الهيكلي مصممة لدعم تلك الملاحظة — لجعل التسلسل مرئيًا وقابلًا للتتبع دون إدخال تفسير شخصي. الهدف هو الوضوح حول حالة السوق الحالية، وليس اليقين بشأن اتجاه السعر المستقبلي.
---
التداول ينطوي على مخاطر. هذا المؤشر هو أداة تحليل فني — طبق دائمًا إدارة مخاطر مناسبة.
الملخص
تقييمات العملاء
5 | 67 % | |
4 | 33 % | |
3 | 0 % | |
2 | 0 % | |
1 | 0 % |


