
Penerangan
Pulse Radar: Analisis Momentum & Dinamik Kitaran Profesional
Penunjuk Pulse Radar adalah suite analitik maju untuk platform yang digerakkan oleh C#, direka untuk mentafsirkan volatiliti pasaran dan mengenal pasti fasa perkembangan harga dengan kebarangkalian tinggi. Berbeza dengan penunjuk tradisional yang tertinggal, Pulse Radar menggunakan penilaian adaptif zon keseimbangan harga, menyediakan peta struktur pasaran yang jelas.
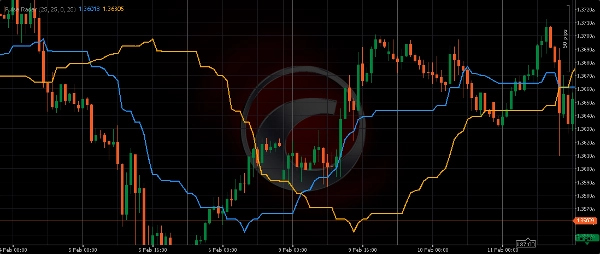
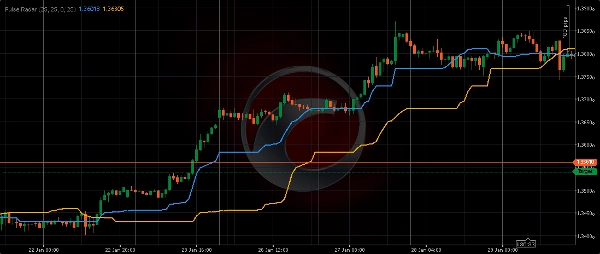
Sistem ini membina dua lengkung analitik proprietari:
- Vektor Aktif (Pantas): Garis berkepekaan tinggi yang mencerminkan momentum segera dan peralihan kecairan jangka pendek.
- Vektor Strategik (Lambat): Lengkung yang dilicinkan mewakili kitaran pasaran dominan dan keseimbangan harga institusi.
Dengan menganalisis kedudukan harga berbanding lengkung ini, pedagang boleh menentukan dengan tepat fasa pasaran semasa dalam hierarki kitaran yang lebih luas. Pulse Radar juga menampilkan penjajaran sejarah maju, membolehkan perbandingan langsung antara pergerakan struktur semasa dan corak tingkah laku masa lalu.
Metodologi Teknikal
- Analisis Titik Ekstrem: Garis dikira berdasarkan ekstrem harga mentah dalam tetingkap tinjauan tertentu, menghapuskan bunyi yang terdapat dalam purata bergerak standard.
- Penyegerakan Fasa: Algoritma menyokong pelarasan offset manual dan automatik untuk menyelaraskan data dengan segmen carta sejarah.
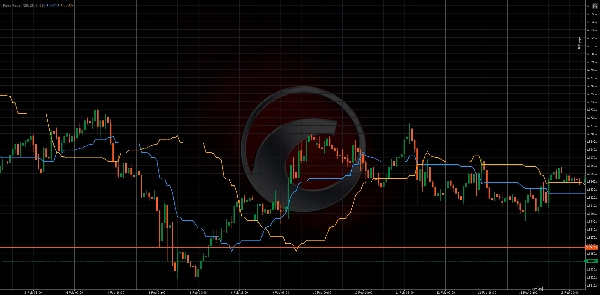
- Interaksi Struktur: Perhimpunan dan perbezaan vektor Aktif dan Strategik menonjolkan peralihan antara fasa pengumpulan dan pengedaran trend.
Kelebihan Utama
- Ketepatan Tanpa Pelicinan: Pengiraan menggunakan data pasaran mentah, memastikan tiada kelewatan buatan diperkenalkan.
- Rangka Kerja Adaptif: Parameter yang boleh dikonfigurasikan sepenuhnya untuk menyesuaikan profil volatiliti aset tertentu.
- Kegunaan Merentas Pasaran: Dioptimumkan untuk Forex Frekuensi Tinggi, Ekuiti AS, Komoditi, dan Kripto.
- Seni Bina Berprestasi Tinggi: Logik C# ringan memastikan tiada kesan pada kestabilan platform semasa volatiliti tinggi.
Parameter Input
- Tempoh Jangkauan (Pantas/Lambat): Menentukan kedalaman data pasaran yang digunakan untuk mengira vektor momentum.
- Pergeseran Fasa (Pantas/Lambat): Membolehkan kalibrasi tepat garis analitik terhadap struktur harga sejarah.
Ringkasan
The indicator employs extreme-point analysis on raw price extremes within defined look-back periods, avoiding the lag and noise typical of standard moving averages. It supports manual and automatic phase shift adjustments to align current data with historical price patterns, enhancing structural interaction insights through the convergence and divergence of its vectors. Pulse Radar operates with zero smoothing, ensuring calculations are based on raw market data for precision without artificial lag.
Input parameters include Reach Period and Phase Shift for both fast and slow vectors, allowing customization to fit specific asset volatility profiles. Its lightweight C# architecture is optimized for high-frequency trading environments, maintaining platform stability during volatile conditions. Pulse Radar is applicable to a wide range of symbols such as BTCUSD, EURUSD, GBPUSD, XAUUSD, and indices like NAS100.
Ulasan pelanggan
5 | 100 % | |
4 | 0 % | |
3 | 0 % | |
2 | 0 % | |
1 | 0 % |


