
Penerangan
Penanda HiLo: Dedahkan Titik Perubahan Pasaran Utama
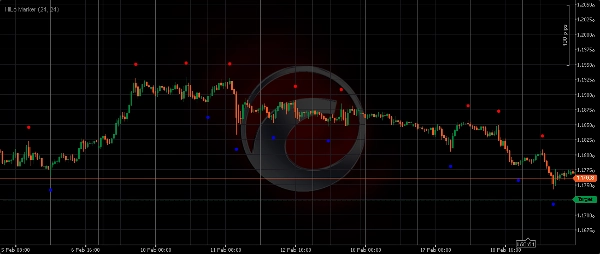
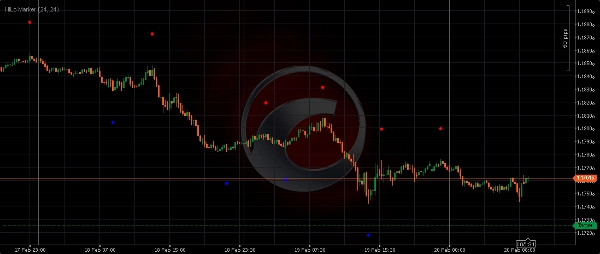
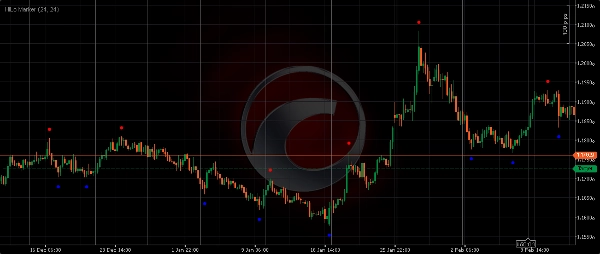
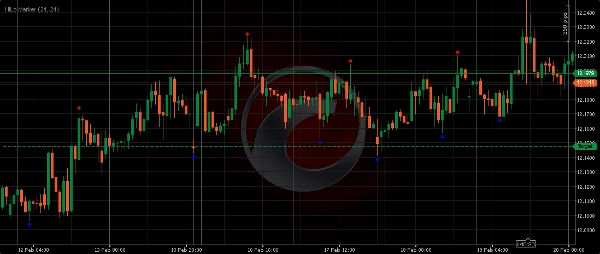
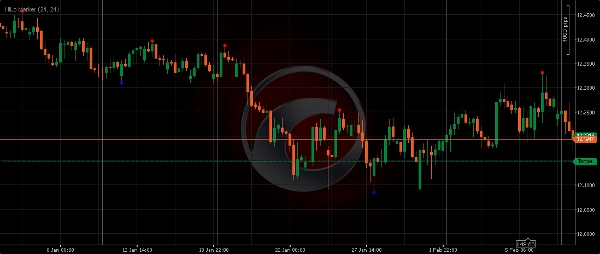
Penanda HiLo adalah penunjuk cTrader yang intuitif dan penting yang direka untuk mengesan dan menyerlahkan Harga Tinggi dan Rendah yang ketara secara automatik berdasarkan tetingkap sejarah yang ditetapkan. Alat ini membawa kejelasan kepada carta anda dengan menghilangkan tekaan dalam mengenal pasti titik ayunan, menawarkan kelebihan visual untuk mana-mana pedagang tindakan harga.
Cara Ia Berfungsi
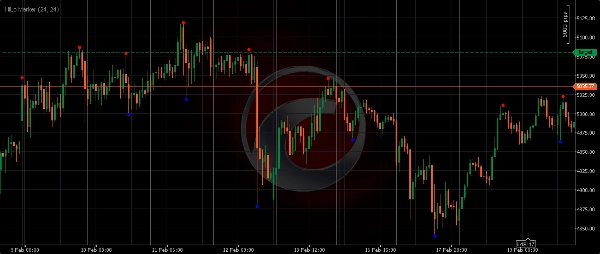
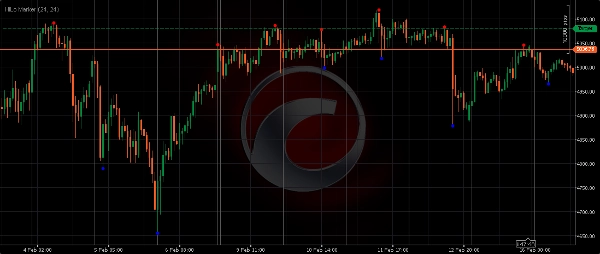
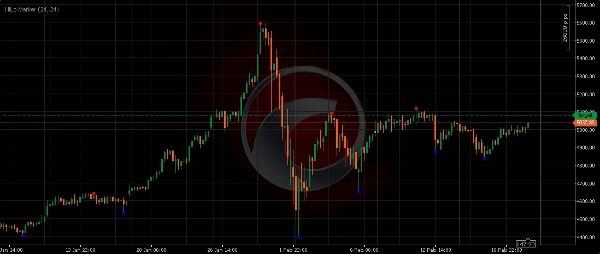
Penunjuk ini mengimbas "Tetingkap Jarak" yang ditentukan (bilangan bar) untuk mencari Harga Tinggi mutlak tertinggi dan Harga Rendah terendah dalam julat itu. Setelah satu bar disahkan sebagai puncak atau lembah tetingkap sekelilingnya, Penanda HiLo meletakkan titik merah atau biru yang jelas (atau anak panah) di atas/bawah lilin itu. Kaedah ini membantu anda mengenal pasti tahap penting secara objektif di mana harga sebelum ini berbalik atau mendapat momentum yang kuat.
Ciri-ciri & Manfaat Utama
- Ketepatan Automatik: Tidak perlu lagi melukis garis secara manual. Penanda HiLo mengenal pasti titik perubahan kritikal secara objektif.
- Struktur Pasaran yang Jelas: Visualisasikan ayunan, tren, dan julat dengan segera, menjadikan analisis carta lebih cekap.
- Zon Sokongan & Rintangan: Harga tinggi dan rendah yang ditandakan sering bertindak sebagai sokongan dan rintangan masa depan, menawarkan titik masuk/keluar dengan kebarangkalian tinggi.
- Serbaguna: Berfungsi dengan sempurna merentasi semua instrumen kewangan (Forex, Emas, Indeks, Kripto, Saham) dan pada mana-mana jangka masa.
- Visual yang Boleh Disesuaikan: Laraskan warna penanda dan jarak offset untuk integrasi carta yang sempurna.
Penjelasan Parameter Input:
- Panjang (Offset): Nilai ini menentukan sejauh mana di atas Harga Tinggi atau di bawah Harga Rendah penanda akan dipaparkan. Nilai yang lebih besar menghasilkan pemisahan visual yang lebih ketara dari lilin.
-
- Contoh:
Length = 24bermaksud penanda akan muncul 24 pip (atau tik, bergantung pada simbol) jauh dari Harga Tinggi/Rendah sebenar.
- Contoh:
- Tetingkap Jarak: Ini adalah tempoh imbasan ke belakang yang digunakan penunjuk untuk mengenal pasti Harga Tinggi atau Rendah. Satu bar hanya ditandakan sebagai Hi/Lo jika ia adalah yang tertinggi/terendah mutlak dalam bilangan bar sekeliling yang ditentukan ini.
-
- Lebih kecil
Dist(contohnya, 10-20): Menangkap ayunan kecil dan bunyi pasaran jangka pendek (sesuai untuk scalping). - Lebih besar
Dist(contohnya, 30-60+): Mengenal pasti ayunan yang lebih besar, tahap institusi dan pembalikan tren utama (ideal untuk perdagangan ayunan atau jangka masa lebih tinggi).
- Lebih kecil
Tingkatkan perdagangan tindakan harga anda dengan Penanda HiLo. Dapatkan perspektif yang lebih jelas tentang dinamik pasaran dan buat keputusan yang lebih bermaklumat. Muat turun sekarang!
Ringkasan
Ulasan pelanggan
5 | 0 % | |
4 | 100 % | |
3 | 0 % | |
2 | 0 % | |
1 | 0 % |


