
3 Bar Triangle by Linda Raschke
Indikator
536 muat turun
Versi 1.0, Sep 2024
Windows, Mac
5.0
Ulasan: 1
Penerangan
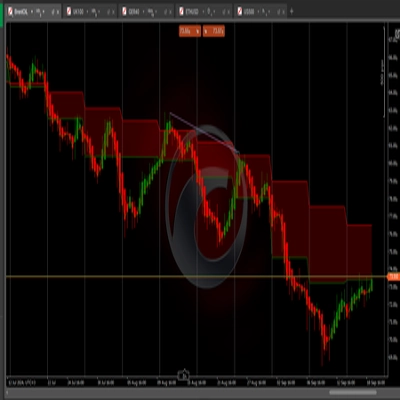
Corak ini mencadangkan pengukuhan atau pengecutan harga, di mana harga mengecut dalam julat yang lebih ketat. Pasaran sedang "menggulung" untuk kemungkinan pecahan ke mana-mana arah, biasanya membawa kepada pergerakan tajam selepas ia melepasi segitiga.
Perdagangan Pecahan:
- Masuk: Pedagang mencari pecahan di atas paras tertinggi corak atau di bawah paras terendah corak, menunjukkan arah pergerakan seterusnya.
- Henti-rugi: Meletakkan henti-rugi di luar sisi bertentangan segitiga (sama ada di atas paras tertinggi atau di bawah paras terendah) membantu mengurus risiko.
- Sasaran: Sesetengah pedagang mensasarkan pergerakan harga yang sama dengan saiz segitiga (jarak antara paras tertinggi dan terendah bar pertama)
Ringkasan
Ringkasan AI
The 3 Bar Triangle indicator by Linda Raschke identifies a consolidation pattern where price contracts within a narrowing range, forming a "triangle" shape over three bars. This pattern signals market "coiling," indicating potential for a sharp breakout in either direction once price moves beyond the triangle boundaries. Traders use this indicator to time entries by watching for a breakout above the pattern’s high or below its low, which suggests the direction of the next price move. Risk management involves placing stop-loss orders just outside the opposite side of the triangle to limit potential losses. Profit targets are often set based on the size of the triangle, aiming for a price movement equal to the distance between the high and low of the initial bar. This indicator supports breakout trading strategies by highlighting periods of price squeezing and potential volatility expansion.
Profil indikator
Ulasan pelanggan
5.0
Ulasan: 1
5 | 100 % | |
4 | 0 % | |
3 | 0 % | |
2 | 0 % | |
1 | 0 % |
Ulasan pelanggan
August 12, 2025
Pros: Identifies classic 3-bar triangle consolidation zones. Simple setup, visually clear. Stable across timeframes. Cons: No alerts or tooltips. Lacks volume filters and signal confirmation. Limited customization
Perbincangan
Soalan Lazim
Breakout
Produk yang tersedia melalui cTrader Store, termasuk bot dagangan, indikator dan plugin, disediakan oleh pembangun pihak ketiga dan diberikan akses untuk tujuan maklumat dan teknikal sahaja. cTrader Store bukan broker dan tidak memberikan nasihat pelaburan, syor peribadi atau sebarang jaminan prestasi masa hadapan.
Lebih banyak produk daripada penulis ini


![Logo "[Hamster-Coder] Bollinger Bands"](https://cdn.ctrader.com/image/webp/21d8e5d6-fb11-4bac-b9ee-cd05c2b76804_30327)


Harga
Sejak 19/09/2024
314.61K
Volum yang didagangkan
258.47K
Pip dimenangi
536
Pemasangan percuma