
Descripción
Perfilador de Retrocesos de Tendencia
Perfilador de Retrocesos de Tendencia es un indicador de cTrader diseñado para analizar cómo respira una tendencia midiendo la profundidad y frecuencia de los retrocesos – ahora también en porcentaje de retroceso de Fibonacci.
Usando un filtro de tendencia basado en EMA, el indicador:
- detecta cuando hay una clara tendencia alcista o tendencia bajista en curso;
- identifica cada retroceso confirmado dentro de esa tendencia;
- mide la profundidad del retroceso en pips;
- calcula el porcentaje de retroceso al estilo Fibonacci relativo a la última pata impulsiva;
- mantiene un seguimiento en vivo de:
-
- cuántos retrocesos ocurrieron en la tendencia actual,
- la profundidad del último retroceso,
- la profundidad promedio de los retrocesos,
- el último porcentaje de retroceso de Fibonacci.
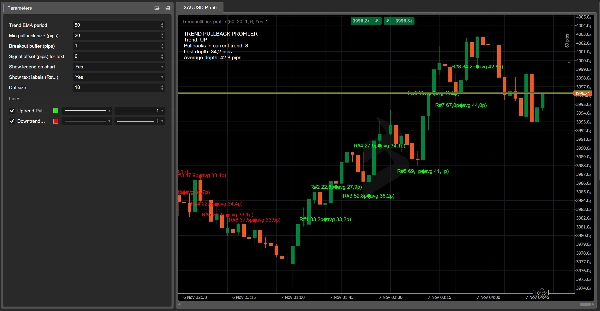
En el gráfico, este:
- coloca un gran punto verde en el mínimo del retroceso en una tendencia alcista,
- un gran punto rojo en el máximo del retroceso en una tendencia bajista,
- opcionalmente imprime una etiqueta compacta como:
22.5 p / 38.2%.
En la esquina superior izquierda, una leyenda dinámica muestra:
- dirección actual de la tendencia (ALCISTA / BAJISTA / NINGUNA);
- número de retrocesos en la tendencia actual;
- profundidad del último retroceso (en pips);
- profundidad promedio de los retrocesos (en pips);
- último porcentaje de retroceso de Fibonacci.
Parámetros clave
- Periodo EMA de la tendencia
Periodo EMA usado para definir la dirección de la tendencia. - Tamaño mínimo del retroceso (pips)
Profundidad mínima requerida del retroceso (en pips) para contar como un retroceso válido. - Buffer de ruptura (pips)
Distancia extra que el precio debe superar más allá del extremo anterior de la tendencia para confirmar una nueva pata y cerrar el retroceso. - Desplazamiento de señal (pips) para texto
Desplazamiento vertical para las etiquetas de texto relativo al máximo/mínimo del retroceso. - Mostrar leyenda en el gráfico
Activa o desactiva la leyenda en el gráfico con la tendencia, último y promedio de métricas. - Mostrar etiquetas de texto cerca de los puntos
Si está activado, imprime una pequeña etiqueta junto al punto con la profundidad del retroceso (y opcionalmente el % de Fibonacci). - Mostrar % de Fibonacci en las etiquetas
Si está activado, muestra tanto pips como % de Fibonacci en la etiqueta (XX.Xp / YY.Y%). - Tamaño del punto
Controla qué tan grandes aparecen los puntos en el gráfico, facilitando la identificación de retrocesos incluso en marcos temporales bajos.
Casos prácticos de uso
- Perfilado visual de qué tan profundos suelen ser los retrocesos en un símbolo/marco temporal dado.
- Planificación de entradas limitadas alrededor de zonas de retroceso típicas en lugar de niveles aleatorios.
- Detección de retrocesos inusualmente profundos (por ejemplo, más allá del 61.8% o 78.6%) que pueden señalar agotamiento de la tendencia o una posible reversión.
- Agregar información objetiva y numérica sobre retrocesos y Fibonacci a tu manual de trading de tendencias.
Cómo se calcula el retroceso de Fibonacci en el Perfilador de Retrocesos de Tendencia
El Perfilador de Retrocesos de Tendencia calcula el porcentaje de retroceso al estilo Fibonacci basado en la última pata impulsiva de la tendencia, no en máximos y mínimos arbitrarios.
En una tendencia alcista
- El indicador rastrea una pata impulsiva desde:
-
- Precio base de la tendencia = último mínimo significativo (fin del retroceso anterior)
- Extremo de la tendencia = último máximo oscilante de la tendencia
- Cuando se forma un retroceso, el indicador mide:
-
- Profundidad del retroceso (precio):
depthPrice = trendHigh – pullbackLow - Tamaño de la pata impulsiva:
legSize = trendHigh – trendBasePrice
- Profundidad del retroceso (precio):
- El porcentaje de retroceso de Fibonacci es:
Fib% = (depthPrice / legSize) * 100
Así que si el precio retrocede aproximadamente entre el 38.2% y el 50% de la última pata impulsiva antes de continuar al alza, verás valores cercanos a 38.2%, 50%, 61.8%, etc.
En una tendencia bajista
- La pata impulsiva va desde:
-
- Precio base de la tendencia = último máximo significativo (fin del retroceso anterior)
- Extremo de la tendencia = último mínimo oscilante de la tendencia
- El retroceso va hacia arriba contra la tendencia, y el indicador mide:
-
- Profundidad del retroceso (precio):
depthPrice = pullbackHigh – trendLow - Tamaño de la pata impulsiva:
legSize = trendBasePrice – trendLow
- Profundidad del retroceso (precio):
- Misma fórmula:
Fib% = (depthPrice / legSize) * 100
De esta manera, cada punto que ves en el gráfico representa un retroceso dentro de un impulso claro de la tendencia actual, expresado tanto en pips como en porcentaje de Fibonacci, para que puedas juzgar rápidamente si un retroceso es superficial, típico o inusualmente profundo.
Resumen
Key features include:
- Detection of trend direction and pullbacks.
- Measurement of pullback depth and Fibonacci retracement percentage.
- Live tracking of the number of pullbacks, last pullback depth, average pullback depth, and last Fibonacci retracement percentage.
- Visual chart elements such as large green dots at pullback lows in uptrends and large red dots at pullback highs in downtrends.
- Optional compact labels displaying pullback depth and Fibonacci percentage.
- A dynamic legend showing current trend direction, pullback counts, and metrics.
The Fibonacci retracement is calculated based on the last impulse leg, defined by the last significant trend base and extreme prices, providing objective numeric data to assess whether retracements are shallow, typical, or unusually deep. The indicator supports various markets including Forex, indices, commodities, cryptocurrencies, and stocks. It offers configurable parameters such as EMA period, minimum pullback size, breakout buffer, and display options for labels and legend.
Valoraciones de clientes
5 | 50 % | |
4 | 50 % | |
3 | 0 % | |
2 | 0 % | |
1 | 0 % |


