
Penerangan
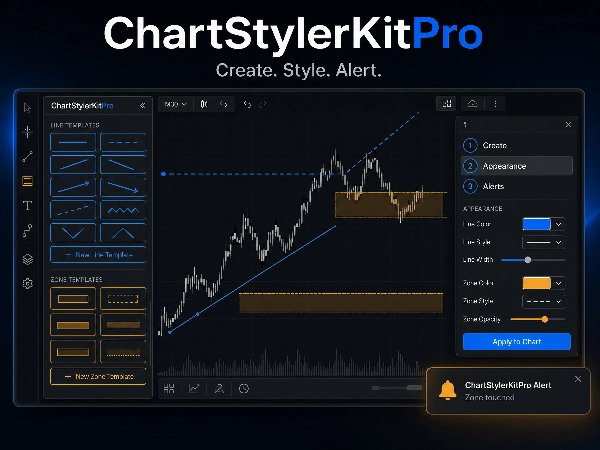
ChartStyleKitPro adalah penunjuk cTrader yang direka sebagai panel kawalan berpusat untuk pengurusan, gaya dan organisasi objek grafik (segi empat tepat dan garis tren). Tujuannya adalah untuk menghapuskan tugas manual dan berulang untuk menggayakan setiap lukisan secara individu pada carta, menawarkan tindakan pukal, templat boleh guna semula dan teks automatik pintar.
Penunjuk ini berfungsi sebagai lapisan atas: ia tidak menjana isyarat atau mengira penunjuk teknikal. Nilainya terletak pada produktiviti dan konsistensi visual analisis carta.
Ciri Utama
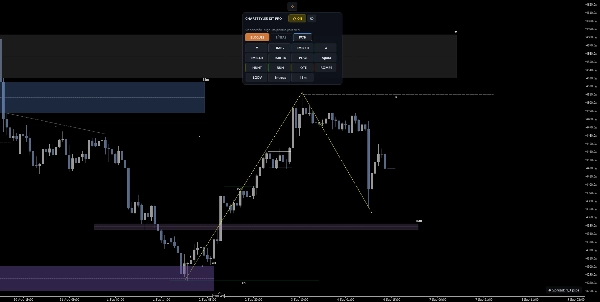
1. Panel kawalan interaktif
Buat templat bernama
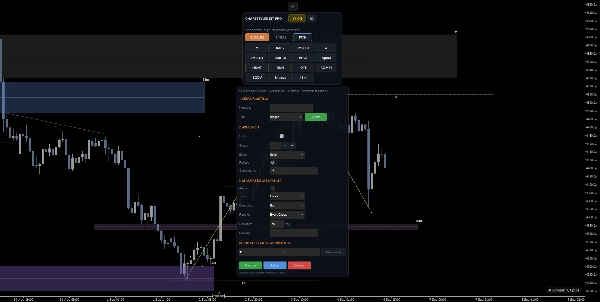
Buka ikon gear dan cari 1. CREATE TEMPLATE. Dalam bahagian ini, taip nama awal templat, pilih Block atau Line dan klik Create. Oleh itu, templat diberi nama dari langkah pertama ini.
Templat baru bermula dengan nilai selamat dan boleh diedit: warna asas, ketebalan, gaya pepejal, isian mengikut jenis dan amaran dilumpuhkan. Penciptaan tidak secara automatik melukis objek; ia terlebih dahulu mendaftar templat supaya ia boleh disemak dan digunakan dari grid.
2. Konfigurasikan penampilan
Pilih sifat visual yang anda ingin guna semula. Klik Save untuk menyimpan perubahan.
3. Garis 50% automatik
Untuk setiap segi empat tepat yang dilukis, penunjuk secara automatik mengira dan melukis garis mendatar di titik tengah (50%) antara harga atas dan bawah segi empat tepat itu.
- Garis adalah bertitik secara lalai (boleh dikonfigurasikan)
- Termasuk label "50%" di tepi kiri
- Dikemas kini secara masa nyata jika anda menggerakkan atau mengubah saiz segi empat tepat
- Disembunyikan/ditunjukkan bersama dengan segi empat tepat induk (berkelakuan sebagai satu objek)
Penggunaan tipikal: zon keseimbangan dalam julat harga, tahap keputusan dalam zon bekalan/permintaan.
3. Automatic 50% line
For each rectangle drawn, the indicator automatically calculates and draws a horizontal line at the midpoint (50%) between the upper and lower price of the rectangle.
- The line is dotted by default (configurable)
- Includes a "50%" label on the left edge
- Updates in real time if you move or resize the rectangle
- Hides/shows together with the parent rectangle (behaving as a single object)
- Typical use: equilibrium zones within a price range, decision levels within supply/demand zones.
4. Teks automatik dalam segi empat tepat
Jika segi empat tepat mempunyai Komen, penunjuk memaparkannya sebagai teks yang kelihatan di dalam segi empat tepat itu.
- Posisi dikira secara automatik: sudut kanan atas dengan margin boleh dikonfigurasikan
- Margin menegak dalam pips (dari tepi atas)
- Margin mendatar dalam jam (dari tepi kanan)
- Saiz fon boleh disesuaikan mengikut saiz tetingkap
- Warna, tebal dan fon boleh dikonfigurasikan
- Penggunaan tipikal: label seperti "Zon Bekalan", "Zon Beli", "FVG", "Blok Pesanan" dipaparkan terus pada zon tanpa perlu teks manual tambahan.
5. Templat gaya
Sistem CRUD lengkap (Cipta, Baca, Kemas kini, Padam) untuk menyimpan dan menggunakan semula konfigurasi visual objek.
Apa yang disimpan oleh setiap templat:
- Warna
- Ketebalan
- Gaya garis (pejal, bertitik, dll.)
- Isian (untuk segi empat tepat)
- Keadaan keterlihatan
- Keadaan kunci
- Komen
Operasi yang tersedia:
TindakanPenerangan
Simpan
Mengeluarkan gaya dari objek yang dipilih dan menyimpannya dengan nama tersuai. Termasuk medan komen pilihan.
Guna
Memuatkan templat yang disimpan dan menggunakannya pada semua objek yang dipilih.
Kemas kini
Menimpa templat sedia ada dengan gaya semasa objek yang dipilih.
Tukar nama
Menukar nama templat yang sedia ada.
Padam
Mengeluarkan templat dari penyimpanan.
Nada hangat, kurang tekanan mata semasa sesi panjang
Warna aksen boleh dikonfigurasikan (lalai biru #4DA6FF). Butang togol secara automatik mengira warna aktif/tidak aktif dengan kontras yang baik dijamin.
Ringkasan
Key features include:
- Interactive control panel: When selecting graphical objects, a floating panel appears showing the count and type of selected items, with buttons to lock/unlock, hide/show, toggle fill for rectangles, hide/show all objects, and manage style templates. Contextual help guides available actions.
- Automatic 50% line: For each rectangle, the indicator draws a horizontal line at the midpoint between its top and bottom prices, updating in real time with movement or resizing. This line includes a "50%" label and hides/shows with its parent rectangle.
- Automatic text rendering: Comments attached to rectangles or trend lines are displayed as text within or above the objects, with configurable position, margins, font size, and style.
- Style templates: A full CRUD system allows saving, applying, updating, renaming, and deleting visual style templates that store color, thickness, line style, fill, visibility, lock state, and comments for objects.
- Four interface color themes: Dark, Light, Midnight, and Warm, each with configurable accent colors and automatic toggle button contrast.
This tool supports efficient management of chart annotations commonly used in market structure and Smart Money Concepts analysis, including supply/demand zones, order blocks, fair value gaps, and support/resistance levels.
Ulasan pelanggan
Perbincangan
Soalan Lazim
















Harga
