
Beschreibung
Harmonic Strategy Suite Pro
Die meisten harmonischen Indikatoren zeichnen ein Muster und lassen Sie raten, ob es
sich lohnt, damit zu handeln. Dieser beantwortet diese Frage: Jedes Muster, das er findet, wird
gegen die eigene Chart-Historie abgespielt, sodass Sie die tatsächliche Trefferquote jedes
Mustertyps auf dem Instrument und Zeitrahmen vor sich sehen – bevor Sie irgendetwas riskieren.
Was es analysiert
Der Indikator arbeitet ausschließlich mit der Preisstruktur – keine Indikatoren auf
Indikatoren, keine Neuzeichnung bestätigter Muster.
Eine originelle Pivot-Engine durchläuft den Chart über eine ganze Bandbreite von Swing-Tiefen
gleichzeitig, sodass Strukturen auf mehreren Skalen erfasst werden, nicht nur die, die Ihre Einstellungen bevorzugen. Aufeinanderfolgende Pivots in gleicher Richtung werden zum
wahren Extrem zusammengeführt, was eine saubere abwechselnde Hoch-Tief-Hoch-Sequenz ergibt.
Jedes aufeinanderfolgende Fünf-Pivot-Fenster (X-A-B-C-D) wird dann mit den
veröffentlichten Fibonacci-Definitionen von sechs klassischen harmonischen Mustern gemessen:
Gartley B bei 0.618 von XA, D bei 0.786
Bat B bei 0.382-0.50, D bei 0.886
Butterfly B bei 0.786, D bei 1.272-1.618
Crab B bei 0.382-0.618, D bei 1.618
Shark B bei 1.13-1.618, D bei 0.886-1.13
Cypher B bei 0.382-0.618, C bei 1.272-1.414, D bei 0.786
Eine Toleranzeinstellung steuert, wie streng diese Verhältnisse eingehalten werden müssen, und jede
Erkennung wird mit 0-100 bewertet, je nachdem, wie nah sie am idealen Verhältnis liegt – so wird ein
typisches Gartley deutlich von einem lockeren unterschieden.
Der Backtester – was das anders macht
Das ist der Teil, den die meisten harmonischen Tools nicht haben.
Für jedes gefundene Muster simuliert der Indikator den Trade, den dieses Muster
erzeugt hätte:
- Eine Limit-Order wird am D-Abschlusspunkt platziert.
- Wenn der Preis das Ziel oder den Stopp ERREICHT, BEVOR D berührt wird, wird das Setup
als ungültig betrachtet und wird nie zu einem Trade – genau wie eine echte
ruhende Order storniert würde.
- Unerfüllte Orders laufen nach 15 Bars ab.
- Gefüllte Trades werden dann Bar für Bar verfolgt, um zu sehen, ob sie
Ziel 1, Ziel 2 oder den Stopp zuerst erreicht haben.
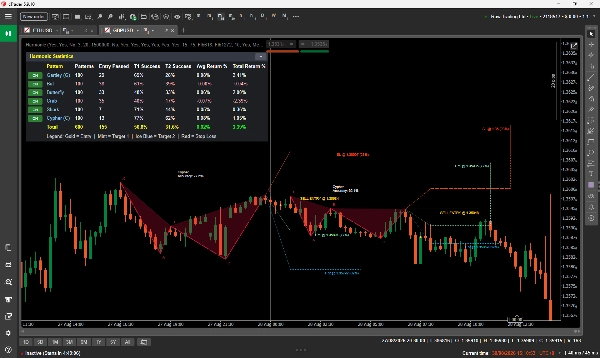
Diese Ergebnisse werden in einem On-Chart-Dashboard zusammengefasst, das pro Mustertyp zeigt:
Gefundene Muster | Gefüllte Einstiege | Trefferquote Ziel 1 | Trefferquote Ziel 2 |
Durchschnittliche Rendite | Gesamtrendite
mit einer kombinierten Gesamtzeile. Verlierende Zeilen werden hervorgehoben, und jeder Mustertyp
hat einen AN/AUS-Schalter, der ihn sofort vom Chart filtert. Das Panel
kann auf eine einzelne Titelleiste reduziert werden, wenn Sie eine klare Ansicht wünschen.
Sie können auf einen Blick sehen, dass zum Beispiel Cypher selten füllt, aber bei diesem Paar oft konvertiert, während Crab öfter füllt und weniger konvertiert. Das ist eine
Beurteilung, auf die Sie reagieren können – und sie wird anhand der Daten Ihres Brokers gemessen, nicht
aus einem Buch zitiert.
Wie man den Chart liest
Jedes Muster wird als sein X-A-B-C-D-Skelett mit schattierten Dreiecken gezeichnet. Die
Schattierung ist nicht dekorativ: Je öfter dieser Mustertyp im Backtest Ziel 1 erreicht hat, desto
solider ist seine Füllung, sodass zuverlässige Strukturen sofort hervorstechen.
Jedes Muster trägt seinen vollständigen Handelsplan:
Goldene Einstiegslinie, beschriftet mit KAUF-EINSTIEG / VERKAUF-EINSTIEG und dem genauen Preis
Mint Ziel 1, beschriftet mit dem Preis und der Trefferquote dieses Musters für T1
Eisblau Ziel 2, gleiche Behandlung
Rot Stop-Loss
Die Liniengestaltung zeigt, was passiert ist. Ein Level, das der Preis tatsächlich erreicht hat, wird
SOLID gezeichnet und stoppt an der Bar, an der es getroffen wurde. Ein Level, das nie erreicht wurde,
bleibt GEPUNKTET und läuft bis zum Ende des Setups. Ein goldener Punkt markiert die
Bestätigungs-Bar. Labels sitzen am Ende ihrer eigenen Linie, mit einem Führungsstrich,
wenn einer verschoben werden muss, um lesbar zu bleiben.
Mustername und Genauigkeit werden neben jeder Struktur gedruckt, unter bullischen Setups
und über bärischen positioniert, sodass sie nie auf der Kursbewegung sitzen.
Wichtige Einstellungen
Einschluss von bullischen / bärischen Mustern Handelsrichtungsfilter
Gartley aktivieren ... Cypher aktivieren Einzelne Muster komplett ausschalten
Pivot Finder Min / Max Tiefe Schwungsensitivitätsbereich (3-20). Ein
höheres Minimum findet weniger, größere
Strukturen
Erlaubter Fib-Verhältnisfehler % Verhältnis-Toleranz. 15 % ist ein ausgewogener
Standard; senken Sie ihn für nur lehrbuchmäßige
Erkennungen
Stop-Loss-Abstand Stop-Platzierung über D hinaus, als
Prozentsatz der AD-Spanne
Ziel 1 / Ziel 2 Verhältnis Fibonacci-Vielfache von AD
Historische Bars zum Scannen Tiefe des Scans und damit die
Stichprobenstatistik
Max. zu zeichnende Muster Chart-Klarheit vs. Vollständigkeit
Statistik-Dashboard anzeigen Dashboard an/aus
Farben und Schriftgröße Volle visuelle Kontrolle
Für wen es gedacht ist
Geeignet für Trader, die harmonische Muster bereits verstehen und die
Mühe automatisieren möchten, plus Beweise dazu – und für fortgeschrittene Trader, die
die Formen kennen, aber nicht sicher sind, welchen sie vertrauen sollen.
Es ist wirklich nützlich für Swing- und Intraday-Trader auf jedem Instrument und jedem
Zeitrahmen: Forex, Indizes, Rohstoffe und Krypto funktionieren alle, weil die Logik
reine Preisgeometrie ist.
Wenn Sie noch nie ein harmonisches Muster gesehen haben, lesen Sie zuerst die Grundlagen.
Der Indikator findet sie für Sie, aber er setzt voraus, dass Sie wissen, was ein Gartley
Ihnen sagen will.
Typische Anwendung
1. An einen Chart anhängen und das Dashboard seine Stichprobe aufbauen lassen.
2. Schauen, welche Mustertypen auf diesem Instrument und
Zeitrahmen tatsächlich performen, und die schwachen ausschalten.
3. Auf einen frischen Abschluss bei D warten, die Genauigkeitsbewertung und die
historische Trefferquote dieses Typs prüfen.
4. Den gezeichneten Einstieg, Stopp und Ziele als Plan verwenden, angepasst an Ihr eigenes Risiko.
Wichtige Hinweise – bitte lesen
- Dies ist ein ANALYSEWERKZEUG. Es platziert, ändert oder schließt keine Order.
Es gibt keinen Autohandel und es greift niemals auf Ihr Konto zu.
- Vergangene Performance ist keine Vorhersage. Das Dashboard berichtet, was diese
Muster historisch auf den geladenen Daten gemacht haben. Es ist ein Beweis für eine
Entscheidung, keine Garantie für die nächste.
- Statistiken benötigen eine Stichprobe. cTrader gibt einem Indikator nur die Bars, die der
Chart tatsächlich geladen hat, also scrollen Sie zurück, um die Historie zu laden, bevor Sie
die Zahlen beurteilen – der Unterschied zwischen ein paar hundert Bars und mehreren
Tausend ist der Unterschied zwischen Rauschen und einer brauchbaren Stichprobe.
- Renditen werden als Prozentsatz des Preises angezeigt. Ein Forex-Paar zeigt naturgemäß
kleinere Prozentsätze als ein Index oder ein Rohstoff; vergleichen Sie Ähnliches mit
Ähnlichem.
- Einstiegsfüllraten sind realistisch niedrig konzipiert. Viele harmonische Setups
füllen nie, weil der Preis zuerst von D wegläuft. Der Indikator zählt
diese ehrlich als unerfüllt, anstatt die Statistik zu beschönigen.
- Tiefe Scans leisten echte Arbeit. Wenn Sie die Balkenzahl auf einer langsamen Maschine
hochschrauben und bei jedem neuen Balken eine Pause sehen, reduzieren Sie die historischen Bars zum Scannen oder erhöhen
die minimale Pivot-Tiefe.
Nur Analyse. Keine DLLs. Keine externen Verbindungen. Es sendet, ändert oder
schließt niemals eine Order.
Zusammenfassung
A key feature is its integrated backtester, which simulates trades for each pattern found on the chart’s historical data. It places hypothetical limit orders at pattern completion points (D), tracks whether targets or stops are hit, and accounts for unfilled orders and invalidated setups. Results are summarized in an on-chart dashboard showing statistics such as patterns found, entries filled, hit rates for two targets, average and total returns per pattern type, with options to filter patterns on or off.
Patterns are visually displayed with their X-A-B-C-D structure, trade entry, stop loss, and target levels, using line styles and shading to indicate historical success rates and trade outcomes. The indicator supports customization of pattern inclusion, pivot sensitivity, Fibonacci ratio tolerance, stop and target distances, and visual settings.
Designed for traders familiar with harmonic patterns, it suits swing and intraday trading across instruments and timeframes including forex, indices, commodities, and crypto. It functions solely as an analysis tool without order execution capabilities.








![„Gaussian Channel [Iridio Capital]“-Logo](https://cdn.ctrader.com/image/webp/2c4f9ca9-4e9b-476d-b5a6-787c8095032b_61546)








