
Penerangan
Fungsi Penunjuk UTBot (Bahasa Itali)
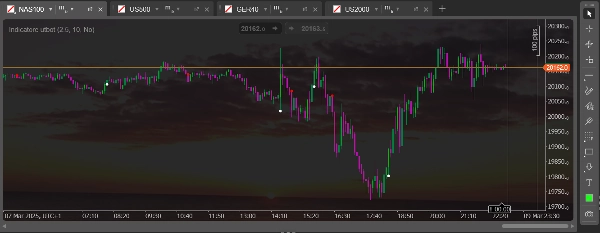
Penunjuk UTBot adalah alat analisis teknikal yang mencipta garis hentian susulan dinamik berdasarkan ATR. Ia mengira nilai hentian menggunakan ATR didarabkan dengan faktor kepekaan, dengan itu mencipta sokongan/rintangan yang menyesuaikan diri dengan turun naik. Ia mengenal pasti aliran menaik apabila harga kekal di atas garis ini dan aliran menurun apabila di bawahnya. Ia menghasilkan isyarat beli apabila harga melintasi garis dari bawah ke atas dan isyarat jual apabila melintasi dari atas ke bawah. Persilangan EMA dengan garis hentian susulan sering digunakan sebagai pengesahan. Ia berkesan dalam pasaran berarah dan untuk mengurus hentian dinamik bagi posisi terbuka.
UTBot Indicator Functionality (English)
The UTBot indicator is a technical analysis tool that creates a dynamic trailing stop line based on ATR. It calculates a stop value using ATR multiplied by a sensitivity factor, creating support/resistance that adapts to volatility. It identifies uptrends when price stays above this line and downtrends when below. It generates buy signals when price crosses above the line from below and sell signals when crossing below from above. An EMA crossover with the trailing stop line is often used as confirmation. It's effective in directional markets and for managing dynamic stops for open positions.
Ringkasan
Ulasan pelanggan
5 | 100 % | |
4 | 0 % | |
3 | 0 % | |
2 | 0 % | |
1 | 0 % |


