
FX Market Sessions
インジケーター
1.86K ダウンロード数
バージョン 1.0、Apr 2025
Windows、Mac
5.0
レビュー: 6
説明
主要市場の開閉時間を正確に把握しましょう。FXマーケットセッションは、4つの主要な取引セッションとその高値・安値レベルを表示し、1日の最も変動の激しい時間帯に合わせてエントリーのタイミングを計るのに役立ちます。
主な特徴
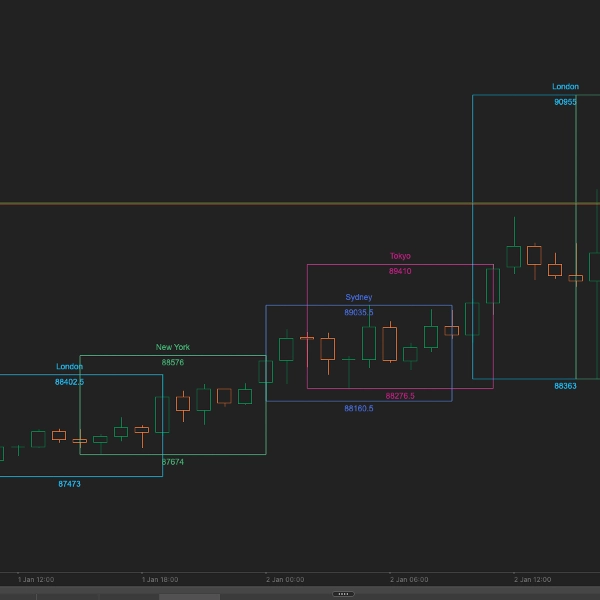
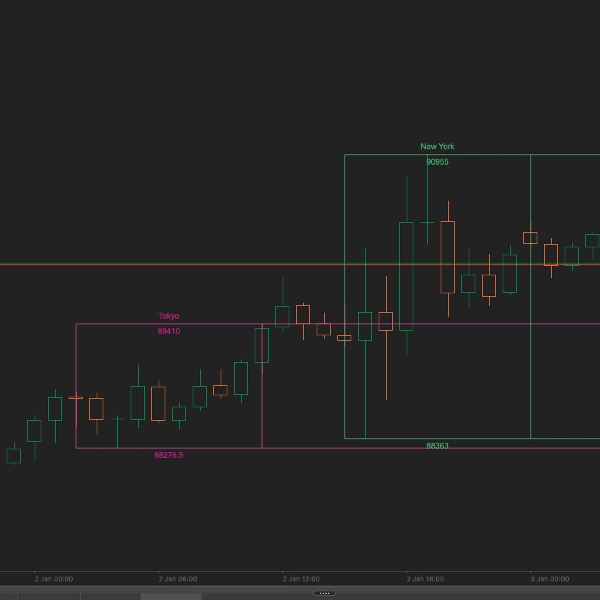
- 4つの主要セッション:シドニー、東京、ロンドン、ニューヨークのセッションをカスタマイズ可能な開始/終了時間と自動夏時間調整付きで表示
- セッションの高値/安値レベル:各セッションの高値と安値を自動で追跡・表示し、サポート/レジスタンス計画のために線を延長可能
- ライブセッション表示:リアルタイム情報パネルで現在開いているセッションを表示し、ロンドンやニューヨークの開始時間を推測する必要なし
- 過去のコンテキスト:過去最大10日分のセッションレベルを表示し、主要なセッション境界での価格反応を確認可能
- 完全カスタマイズ可能:表示するセッションの選択、カスタムカラーの設定、高値/安値レベルの無限延長の有無を決定可能
仕組み
インジケーターは、それぞれの現地時間帯に基づいて4つの主要な外国為替取引セッションを自動的に計算します:
- シドニー:21:00-06:00 AEST(夏時間調整あり)
- 東京:00:00-09:00 JST
- ロンドン:08:00-17:00 GMT(夏時間調整あり)
- ニューヨーク:13:00-22:00 EST(夏時間調整あり)
各セッションは縦のゾーンとして描画され、その高値と安値レベルがマークされます。右上の情報パネルには、現在開いているセッションがリアルタイムで表示されます。
パラメーター
一般設定
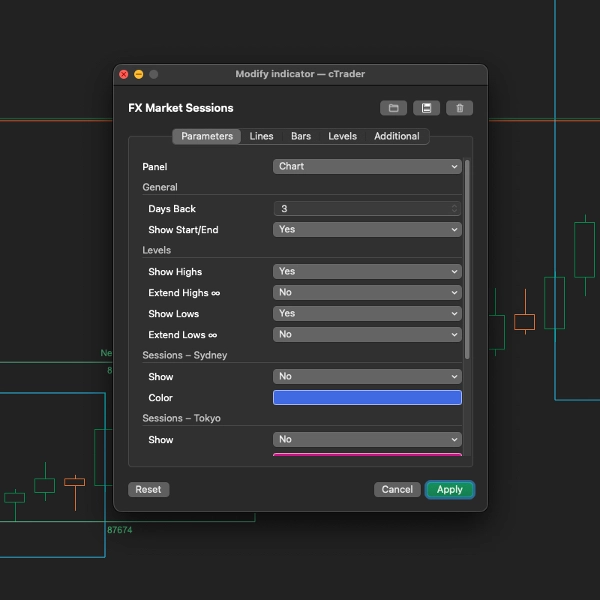
- 過去日数(デフォルト:3):セッションボックスを表示する過去の日数(0-10)
- 開始/終了表示(デフォルト:True):セッションの開始・終了時間に垂直線を描画
レベル設定
- 高値表示(デフォルト:True):各セッションの高値レベルを表示
- 高値延長(デフォルト:False):高値ラインをチャートの右端まで延長
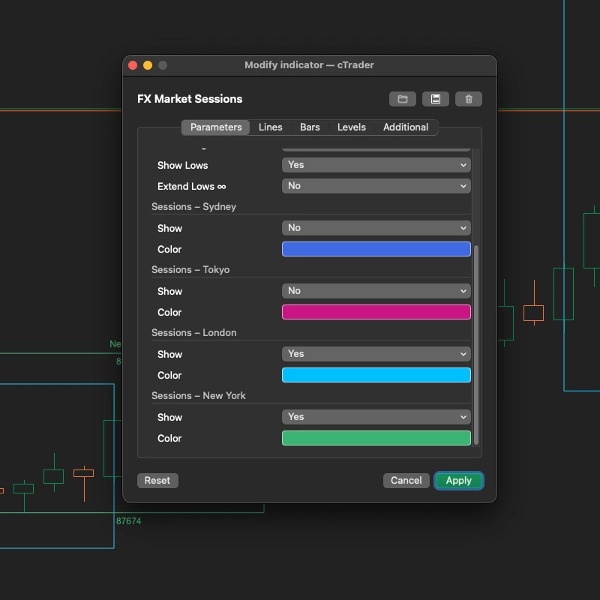
- 安値表示(デフォルト:True):各セッションの安値レベルを表示
- 安値延長(デフォルト:False):安値ラインをチャートの右端まで延長
セッション設定(シドニー、東京、ロンドン、ニューヨーク)
- 表示:個別のセッションを有効または無効にする
- 色:各セッションの表示要素のカスタムカラー
対象ユーザー
- ボラティリティの増加時間を知る必要があるデイトレーダー
- セッション開始時のブレイクアウトトレーダー
- セッションの高値/安値レベルをサポート/レジスタンスとして利用するトレーダー
- 最適な取引時間を視覚化したいすべての人
取引のヒント
- ロンドンオープン:最も変動の激しい時間帯の一つであり、しばしばその日の方向性を決定します
- ロンドン/ニューヨークの重複時間:13:00-16:00 GMTは通常、最も取引量とボラティリティが高い時間帯です
- アジアセッション:JPYペアやAUDペアの取引に最適です
- セッションブレイクアウト:価格がセッションの高値/安値を突破すると継続的な動きを示すことがあります
対応タイムフレーム
M5からH4までのタイムフレームで最適に動作します。インジケーターはチャートのスケールに合わせてセッションボックスを自動調整します。
概要
AIによる概要
FX Market Sessions is an indicator designed for forex traders to visualize the four major trading sessions—Sydney, Tokyo, London, and New York—directly on their charts. It automatically calculates session times based on local time zones and adjusts for daylight saving time. The indicator marks session start and end times with optional vertical lines and displays each session as a colored zone.
Key features include automatic plotting of session high and low price levels, with options to extend these levels across the chart for support and resistance analysis. A live info panel shows which sessions are currently open in real-time. Users can customize which sessions to display, adjust colors, and set how many past days (up to 10) of session data to show, excluding weekends.
The indicator is optimized for intraday timeframes, working best on 5-minute to 4-hour charts. It provides historical context by showing previous session levels, aiding traders in timing entries around periods of increased volatility such as the London open and the London/New York overlap. This tool supports trading strategies that rely on session timing and price levels for breakout and intraday trading decisions.
インジケーターのプロフィール
カスタマーレビュー
5.0
レビュー: 6
5 | 100 % | |
4 | 0 % | |
3 | 0 % | |
2 | 0 % | |
1 | 0 % |
カスタマーレビュー
December 23, 2025
August 12, 2025
Pros: Highlights Tokyo, London, and New York sessions with custom colors. Ultra-light performance. Clean and intuitive display. Cons: No alerts or tooltips. Missing template saving. Provides no trading signals by itself.
May 13, 2025
It's a five star review from me. I've been searching for market session indicator until I found this. Best market session indicator!
ディスカッション
よくあるご質問
Forex
EURUSD
GBPUSD
XAUUSD
USDJPY
cTrader Storeで入手可能な取引ボット、インジケーター、プラグインなどの商品は、第三者の開発者が提供するものであり、情報と技術の取得のみを目的としてご利用いただけます。cTrader Storeはブローカーではなく、投資助言や個人的な推奨を行うことも、将来のパフォーマンスを保証することもありません。


価格
登録日 04/04/2025
8
販売
1.95K
無料インストール