
BWMFI_Visual
Wskaźnik
79 pobrania
Wersja 1.0, May 2025
Windows, Mac
Opis
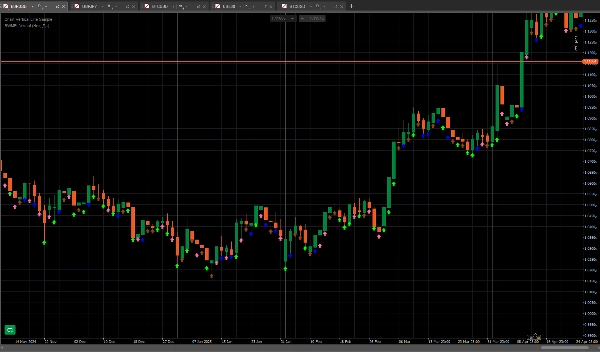
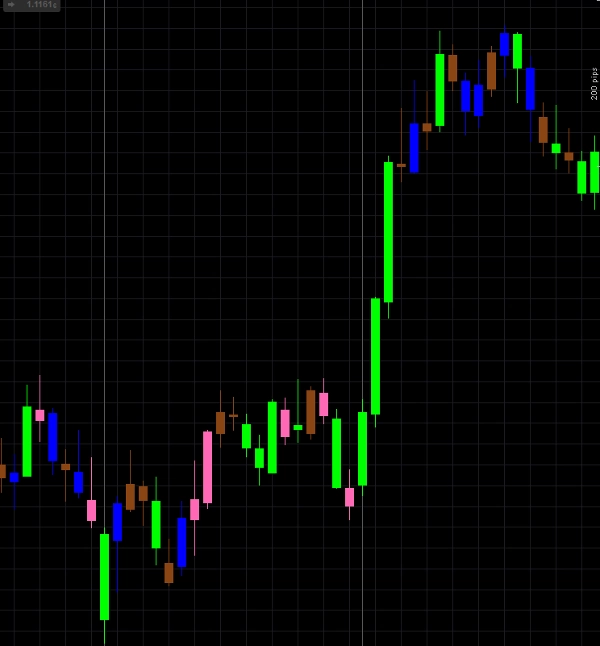
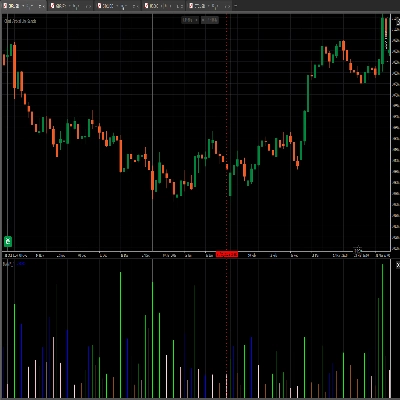
Słupki kolorów wizualnych BW_MFI
Podsumowanie
Podsumowanie AI
BWMFI_Visual is a trading indicator that visually represents the Money Flow Index (MFI) using color-coded bars. It provides a graphical display of the MFI values to assist traders in analyzing market momentum and potential price reversals. The indicator focuses on enhancing the visual interpretation of the MFI by applying distinct colors to the bars, facilitating quicker and clearer decision-making. This tool is designed for integration within trading platforms that support custom indicators.
Profil wskaźnika
Opinie klientów
0.0
Opinie: 0
Opinie klientów
Ten produkt nie ma jeszcze opinii. Wypróbowałeś(-aś) go już? Bądź pierwszy(-a) i powiedz o tym innym!
Dyskusja
Częste pytania
Produkty dostępne za pośrednictwem cTrader Store, w tym boty handlowe, wskaźniki i wtyczki, dostarczane są przez deweloperów zewnętrznych i udostępniane wyłącznie w celach informacyjnych oraz w celu zapewnienia dostępu technicznego. cTrader Store nie jest brokerem i nie zapewnia doradztwa inwestycyjnego, nie udziela spersonalizowanych rekomendacji ani nie gwarantuje przyszłych wyników.
Więcej od tego autora


Cena
Od 10/03/2025
139
Bezpłatne instalacje