
설명
✨ 왜 선택해야 하나요
기능
설명
🎯 적응형 피벗 감지
스마트 피벗 감지 알고리즘을 사용하여 높은 정확도로 잠재적 반전 지점을 식별합니다
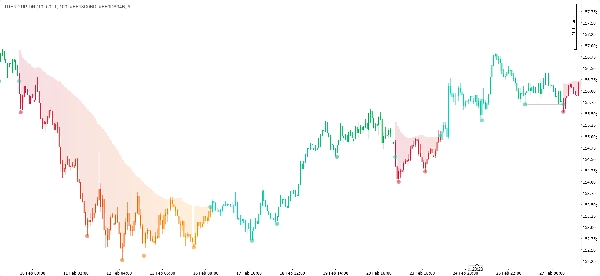
📊 동적 적응 밴드
ATR 및 SMA를 사용하여 시장 변동성에 따라 자동으로 확장 및 축소됩니다
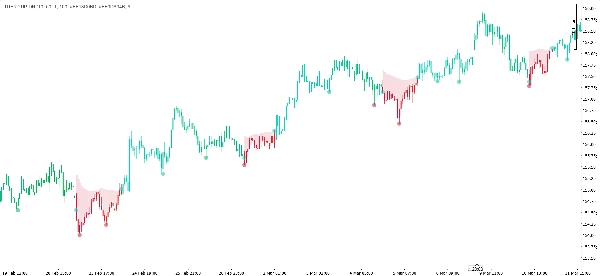
🎨 스마트 캔들 색상
캔들이 "신선함"에서 "성숙함"으로 그라데이션되어 추세 강도를 시각적으로 평가할 수 있습니다
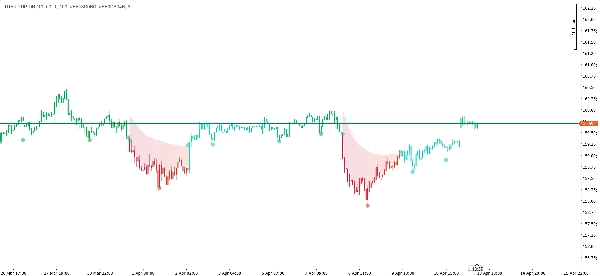
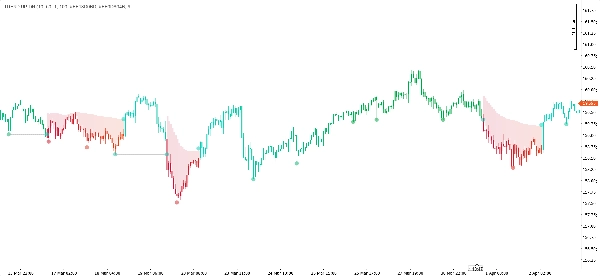
🟦 중요 구역 음영 처리
투명한 채우기로 약세 저항 구역을 강조하여 시장 읽기를 용이하게 합니다
⚡ 명확한 진입/퇴장 신호
가격이 밴드 또는 주요 지지선을 돌파할 때 색 점이 나타납니다
🧹 깔끔하고 복잡하지 않은 인터페이스
밴드는 약세 구간에서만 나타나며 강세 구간에서는 자동으로 사라집니다
🔧 완전한 사용자 설정 가능
색상, 투명도 및 지표 민감도를 완벽하게 제어할 수 있습니다
⚙️ 매개변수 설명
🔹 그룹: 설정
매개변수
기본값
설명
피벗 감지 길이
5
피벗 포인트를 확인하기 위한 캔들 수 (높을수록 정확도 증가, 신호는 감소)
적응 밴드 최대 길이
50
약세 밴드의 SMA 계산을 위한 최대 조회 기간
적응 밴드 배수
1.0
밴드 폭을 위한 ATR 배수 — 증가시키면 밴드가 넓어지고 잘못된 신호가 줄어듭니다
🔹 그룹: 추세 스타일
매개변수
기본값
설명
추세 노화 길이
100
"신선함"에서 "성숙함"으로 색상 전환을 위한 캔들 수
강세 신선 색상
#FF18D0BD
새로 형성된 강세 추세의 색상
강세 성숙 색상
#FF0DA94B
확립된/강한 강세 추세의 색상
약세 신선 색상
#FFCF1D3A
새로 형성된 약세 추세의 색상
약세 성숙 색상
#FFFF8C00
확립된/강한 약세 추세의 색상
채우기 불투명도 (0-100%)
15
약세 구역 음영의 투명도 수준 (0 = 투명, 100 = 불투명)
📖 사용 방법 — 단계별
🔵 강세 구간 — 밴드 숨김
12345678
🔴 약세 구간 — 빨간 밴드 표시
12345678
🔄 추세 전환 논리
1234567891011
💡 전문가 거래 팁
🔸 권장 시간대: M15 이상에서 가장 잘 작동 — 시장 소음을 줄이기 위해 매우 짧은 시간대는 피하세요.
🔸 위험 관리: 피벗 포인트(원형 표시)를 잠재적 손절매 수준으로 사용하세요.
🔸 신호 확인: 볼륨 분석 또는 모멘텀 오실레이터(RSI, MACD 등)와 결합하여 더 높은 확률의 진입 신호를 얻으세요.
🔸 시각적 사용자 설정: 차트 테마에 맞게 색상을 조정하세요 — 부드러운 색상은 긴 거래 세션 동안 눈의 피로를 줄여줍니다.
🔸 먼저 백테스트: 거래 스타일과 도구에 맞게 매개변수를 미세 조정하려면 항상 데모 계정에서 먼저 테스트하세요.
🔸 다중 도구 사용: 이 지표는 다양한 변동성 프로필에 적응 — 외환 쌍, 금, 지수 및 암호화폐에 적합합니다.
📦 시스템 요구 사항
✅ 플랫폼: cTrader (버전 5.0 이상)
✅ 언어 지원: C# / cAlgo API
✅ 권한: 특별한 접근 권한 필요 없음 (AccessRights: 없음)
✅ 호환성: 모든 외환 쌍, 상품, 지수 및 암호화폐에서 작동
✅ 성능: 최소한의 리소스 사용으로 실시간 계산에 최적화됨
🔧 설치 지침
.cs 지표 파일을 다운로드하세요
cTrader 열기 → 자동 거래 → cAlgo
"추가" 클릭 → 다운로드한 파일 찾아 선택
지표 컴파일 (오류 없음 예상)
차트에 첨부: 차트 우클릭 → 지표 → Trend Pulse [BigBeluga]
설정 패널에서 매개변수 사용자 지정
"확인" 클릭하여 적용
🔄 업데이트 및 유지보수
지표는 새 캔들마다 자동으로 계산을 업데이트합니다
차트 객체(선, 점, 사각형)는 복잡함을 방지하기 위해 자동으로 관리됩니다
수동 정리 불필요 — 모든 임시 그리기는 내부적으로 처리됩니다
⚠️ 면책 조항: 이 지표는 교육 및 분석 목적으로만 사용됩니다. 금융 시장 거래는 상당한 손실 위험을 수반합니다. 과거 성과가 미래 결과를 보장하지 않습니다. 투자 결정에 단일 지표에만 의존하지 마십시오. 항상 자체 분석을 수행하고 필요시 공인 금융 고문과 상담하세요.
🎁 진정한 시장 펄스를 경험할 준비가 되셨나요?
1
🔹 지원 또는 기술 문의: 직접 연락하세요
🔹 향후 업데이트: 공식 채널을 팔로우하세요
"분석의 명확성 = 결정의 자신감" 🎯
📋 빠른 참조 요약표
12345678910111213141516
© Trend Pulse [BigBeluga] — 원본 Pine Script by BigBeluga에서 영감을 받았으며, CC BY-NC-SA 4.0 라이선스 하에 있습니다. cTrader 적응 및 개선은 [Your Name/Brand]에서 진행했습니다.
요약
Visual elements include smart candle coloring that transitions from "Fresh" to "Mature" to indicate trend strength, and shaded bearish resistance zones for clearer market interpretation. Entry and exit signals are marked by colored dots when price breaks the band or key support levels. The interface remains clean by displaying the bearish band only during downtrends, disappearing automatically in bullish phases.
Users have full customization over colors, transparency, and sensitivity parameters, allowing adaptation to various trading styles and instruments. The indicator supports multiple markets including forex pairs, commodities, indices, and cryptocurrencies, and is optimized for timeframes of 15 minutes and above to reduce noise. It updates calculations in real time with minimal resource usage and manages chart objects automatically to prevent clutter.
TREND UP-DN is implemented in C# using the cAlgo API and requires no special permissions. It is intended for analytical and educational purposes to assist traders in identifying trend phases and potential reversal points.


