
Opis
Przegląd
Swing Flow to zaawansowany wskaźnik podążający za trendem, który wyświetla się bezpośrednio na wykresie cenowym, dając czysty, intuicyjny sygnał wizualny — podobny stylem do klasycznego SuperTrend — ale oparty na zasadniczo innej i bardziej wyrafinowanej logice.
Podczas gdy standardowe wskaźniki trendu reagują na każdą świecę, Swing Flow opiera swoje obliczenia na istotnych punktach zwrotnych rynku, tworząc linię, która naprawdę odzwierciedla dominujący trend z dużo mniejszym szumem i fałszywymi sygnałami.
Jak to działa (bez ujawniania formuły)
Swing Flow identyfikuje znaczące lokalne maksima i minima na rynku — naturalne punkty zwrotne, gdzie cena faktycznie się odwróciła. Następnie buduje dynamiczny poziom środkowy oraz dwa adaptacyjne pasma (górne i dolne) wokół tych punktów, stosując wygładzanie dostosowane do zmienności, aby odfiltrować krótkoterminowe wahania.
Efektem jest pojedyncza linia trendu wyświetlana na wykresie:
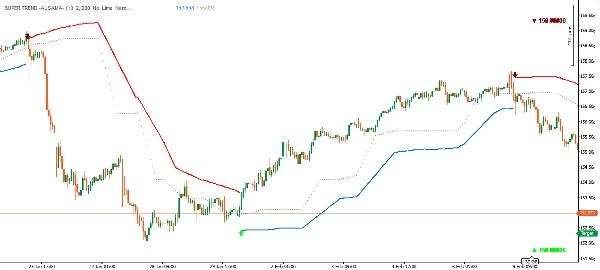
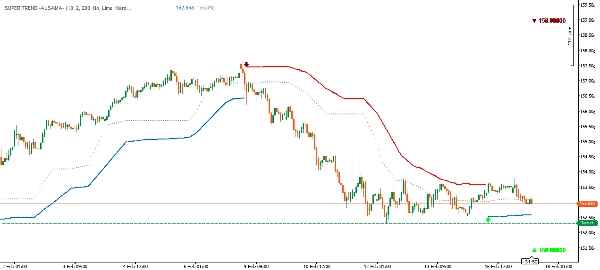
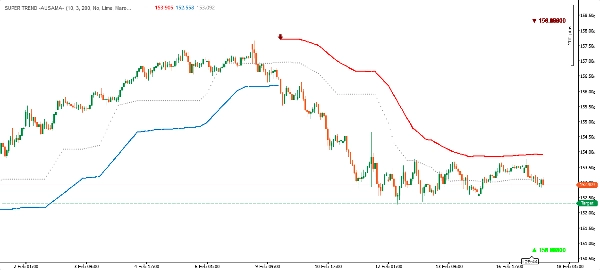
- 🟢 Zielona linia poniżej ceny → Trend wzrostowy (działa jako dynamiczne wsparcie)
- 🔴 Czerwona linia powyżej ceny → Trend spadkowy (działa jako dynamiczny opór)
Gdy trend się odwraca, linia zmienia stronę i kolor — dokładnie jak SuperTrend — co czyni sygnał natychmiast oczywistym i możliwym do wykorzystania.
Składniki wskaźnika
SkładnikOpis
Główna linia trendu
Podstawowa linia sygnału — zielona poniżej ceny w trendzie wzrostowym, czerwona powyżej w trendzie spadkowym
Górne pasmo
Dynamiczny poziom oporu, widoczny podczas faz spadkowych
Dolne pasmo
Dynamiczny poziom wsparcia, widoczny podczas faz wzrostowych
Linia środkowa
Adaptacyjna linia środkowa wyprowadzona ze struktury rynku
Markery sygnałowe
Strzałki w górę/w dół z etykietami cen przy każdym odwróceniu trendu
Etykiety pivotów (opcjonalne)
Markery diamentowe na lokalnych maksimach i minimach (można włączać/wyłączać)
Kluczowe zalety
✅ Logika oparta na strukturze
W przeciwieństwie do większości wskaźników trendu, które patrzą tylko na ostatnie ruchy cen, Swing Flow opiera się na faktycznych punktach zwrotnych — poziomach, które rynek sam uznał za istotne. To sprawia, że sygnał trendu jest zasadniczo bardziej znaczący.
✅ Adaptacyjny filtr zmienności
Pasma automatycznie dostosowują się do bieżącej zmienności rynku, zwężając się w spokojnych warunkach i rozszerzając podczas okresów wysokiej zmienności. Redukuje to fałszywe sygnały bez konieczności ręcznej regulacji.
✅ Czysty wygląd w stylu SuperTrend
Pomimo zaawansowanej logiki, wizualizacja jest czysta i znajoma. Jedna linia na wykresie — zielona poniżej, czerwona powyżej. Bez bałaganu. Natychmiast czytelna na każdym interwale czasowym.
✅ Precyzyjne sygnały wejścia
Każda zmiana trendu jest oznaczona strzałką kierunkową i dokładną ceną zamknięcia na świecy odwrócenia, dając jasny punkt odniesienia do wejść.
✅ Pełna personalizacja kolorów
Kolory zarówno dla trendu wzrostowego, jak i spadkowego są w pełni konfigurowalne, aby dopasować się do stylu wykresu lub osobistych preferencji.
✅ Działa na wszystkich rynkach i interwałach
Forex, indeksy, surowce, kryptowaluty — wskaźnik naturalnie dostosowuje się do każdego instrumentu i interwału dzięki konstrukcji uwzględniającej zmienność.
Jak używać
Podążanie za trendem: Podążaj za trendem w kierunku linii — kupuj, gdy linia jest zielona (poniżej ceny), sprzedawaj lub trzymaj się z dala, gdy linia jest czerwona (powyżej ceny).
Dynamiczne wsparcie i opór: Aktywne pasmo służy jako poziom wsparcia (w trendzie wzrostowym) lub oporu (w trendzie spadkowym) w czasie rzeczywistym. Powrót ceny do linii bez jej przebicia to sygnał kontynuacji.
Sygnały wejścia: Markery strzałek (▲ / ▼) wskazują potwierdzoną zmianę trendu. Można ich używać jako wyzwalaczy wejścia, zwłaszcza gdy są zgodne z innymi sygnałami na wykresie.
Referencja pivotów (opcjonalnie): Włącz "High & Lows", aby wyświetlić punkty zwrotne swing, które wskaźnik wykorzystuje wewnętrznie. Przydatne do szybkiego zrozumienia struktury rynku.
Swing Flow a standardowy SuperTrend
CechaStandardowy SuperTrendSwing Flow
Podstawa obliczeń
Każda pojedyncza świeca
Zweryfikowane punkty zwrotne rynku
Szum sygnału
Wyższy — reaguje na każdą świecę
Niższy — oparty na strukturze
Fałszywe sygnały
Częstsze na rynkach o zmienności bocznej
Znacznie zredukowane
Adaptacyjność
Stały mnożnik ATR
Pasma wygładzane zmiennością
Styl wizualny
Pojedyncza linia
Pojedyncza linia + pasma + poziom środkowy
Potwierdzenie wejścia
Zmiana koloru
Strzałka + etykieta ceny przy odwróceniu
Widoczność pivotów
Brak
Opcjonalne markery pivotów
Krótko mówiąc: Swing Flow wygląda jak SuperTrend, ale myśli jak trader analizujący ruchy cen.
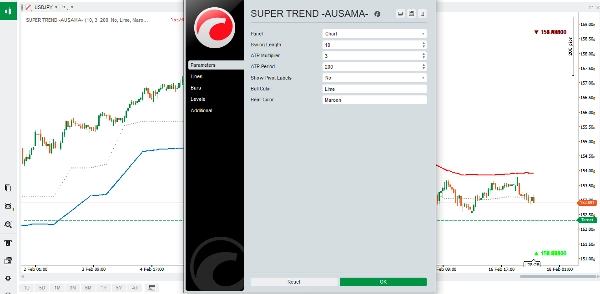
Parametry wejściowe
ParametrDomyślnyOpis
Długość swingu
10
Kontroluje czułość wykrywania pivotów
Mnożnik ATR
2.0
Szerokość pasma względem zmienności
Okres ATR
200
Okres pomiaru zmienności
Pokaż etykiety pivotów
Wyłączone
Przełącz markery lokalnych maksimów/minimów na wykresie
Kolor byków
Limonkowy
Kolor dla trendu wzrostowego
Kolor niedźwiedzi
Kasztanowy
Kolor dla trendu spadkowego
Wskazówki dla najlepszych rezultatów
- Niższa długość swingu (5–8): Bardziej czuły, więcej sygnałów — odpowiedni do skalpowania lub aktywnego handlu.
- Wyższa długość swingu (14–20): Mniej, ale wyższej jakości sygnałów — odpowiedni do handlu swingowego lub pozycyjnego.
- Zwiększ mnożnik ATR na rynkach o wysokiej zmienności (np. kryptowaluty), aby uniknąć fałszywych odwróceń.
- Zmniejsz mnożnik ATR na stabilnych, trendujących rynkach dla ostrzejszych sygnałów.
- Najlepiej używać z potwierdzeniem trendu z wyższych interwałów czasowych.
Swing Flow — tam, gdzie struktura rynku spotyka się z klarownością trendu.


