الوصف
📈 مؤشر القوة النسبية العشوائي
مؤشر مؤشر القوة النسبية العشوائي هو مذبذب زخم يطبق صيغة العشوائي على قيم مؤشر القوة النسبية بدلاً من السعر، مما يجعله مؤشر مشتق ثانوي. وهو مفيد بشكل خاص لتحديد حالات الشراء المفرط والبيع المفرط بحساسية أعلى من مؤشر القوة النسبية القياسي.
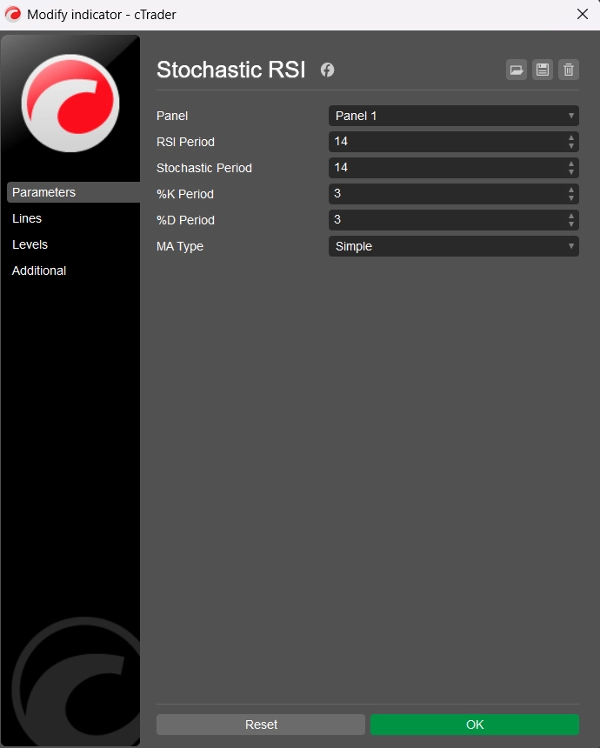
🛠️ المعلمات
فترة مؤشر القوة النسبية: فترة النظر للخلف المستخدمة لحساب مؤشر القوة النسبية الأساسي (الافتراضي = 14)
الفترة العشوائية: فترة النظر للخلف المطبقة على قيم مؤشر القوة النسبية لحساب مؤشر القوة النسبية العشوائي (الافتراضي = 14)
فترة %K: فترة التنعيم لخط %K (الافتراضي = 3)
فترة %D: فترة التنعيم لخط %D (الافتراضي = 3)
نوع المتوسط المتحرك: نوع المتوسط المتحرك للتنعيم: بسيط أو أسي (الافتراضي = بسيط)
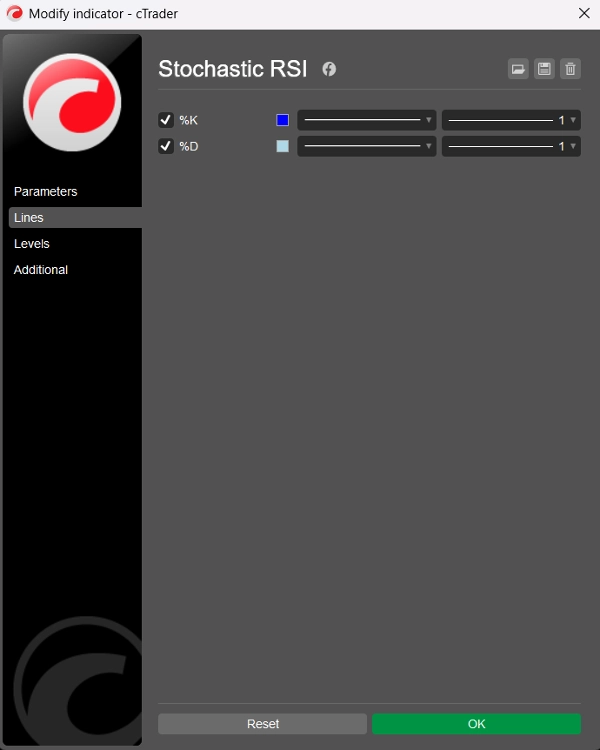
📊 خطوط الإخراج
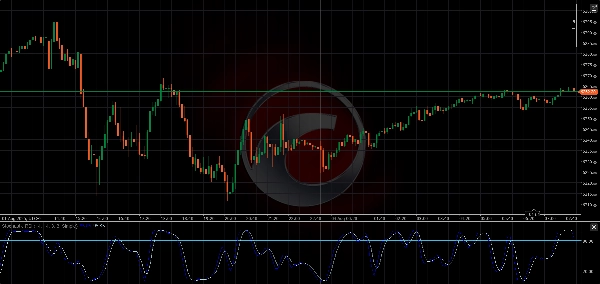
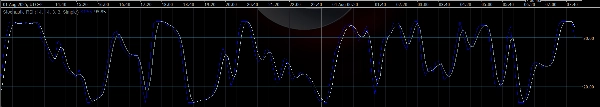
- خط %K: مؤشر القوة النسبية العشوائي المملس (أزرق)
- خط %D: المتوسط المتحرك المملس لخط %K (أزرق فاتح)
كلا الخطين يتأرجحان بين 0 و 100، مما يسمح بقراءات واضحة لحالات الشراء والبيع المفرط.
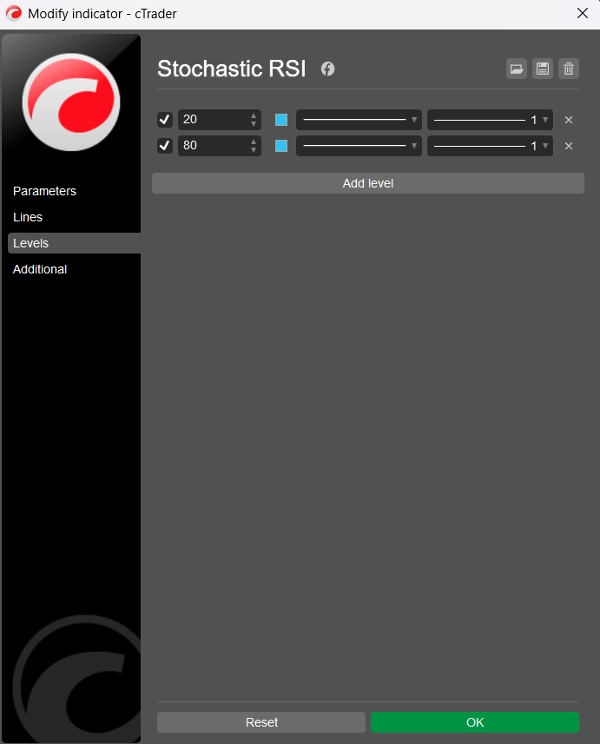
⚠️ المستويات المقترحة
على الرغم من أن المؤشر لا يعرض مستويات ثابتة بشكل افتراضي، يُنصح المستخدمون بإضافة هذه يدويًا عبر تبويب “المستويات” في cTrader:
- المستوى 80 → شراء مفرط
- المستوى 20 → بيع مفرط
تعمل هذه المستويات بطريقة مشابهة لمذبذب العشوائي التقليدي ولكن مطبقة على سلوك مؤشر القوة النسبية، مما يجعل الإشارات أكثر حدة وغالبًا أسرع.
🧠 كيفية الاستخدام
- شراء مفرط (>80): قد يشير إلى أن السعر مفرط في الارتفاع — احتمال حدوث انعكاس أو تماسك.
- بيع مفرط (<20): قد يشير إلى أن السعر مفرط في الانخفاض — احتمال حدوث ارتداد أو انعكاس اتجاه.
- تقاطع %K و %D: يمكن استخدامه بطريقة مشابهة للعشوائي أو MACD — تقاطع صعودي تحت 20 أو تقاطع هبوطي فوق 80 قد يكون قابلًا للتنفيذ.
🏷️ ملاحظات
- مصمم لـ cTrader باستخدام C# وواجهة برمجة التطبيقات Automate
- نظيف، فعال، وقابل للتخصيص مع نوعي متوسط متحرك
- الشفرة والمنطق بواسطة BlueRocketBots و ChatGPT (OpenAI)
- شفرة نظيفة (إجمالي 109 أسطر؛ 60 سطر كود، 29 سطر نص، 20 سطر فارغ)
- مجانًا!