Opis
📈 Stochastic RSI
Wskaźnik Stochastic RSI to oscylator momentum, który stosuje wzór Stochastic do wartości RSI zamiast do ceny, co czyni go wskaźnikiem drugiego rzędu. Jest szczególnie przydatny do identyfikacji stanów wykupienia i wyprzedania z większą czułością niż standardowy RSI.
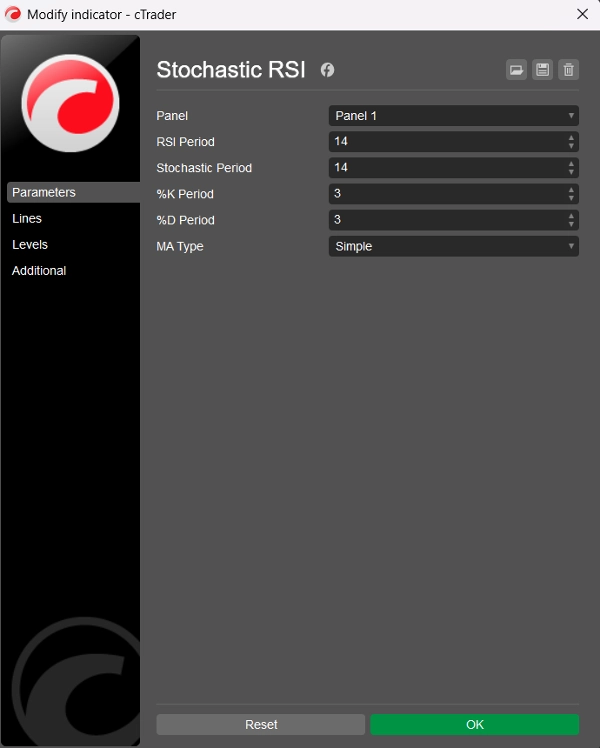
🛠️ Parametry
Okres RSI: Okres wstecz używany do obliczenia bazowego RSI (domyślnie = 14)
Okres Stochastic: Okres wstecz stosowany do wartości RSI w celu obliczenia Stochastic RSI (domyślnie = 14)
Okres %K: Okres wygładzania dla linii %K (domyślnie = 3)
Okres %D: Okres wygładzania dla linii %D (domyślnie = 3)
Typ MA: Typ średniej kroczącej do wygładzania: wybór spośród 11 typów (domyślnie = Prosta)
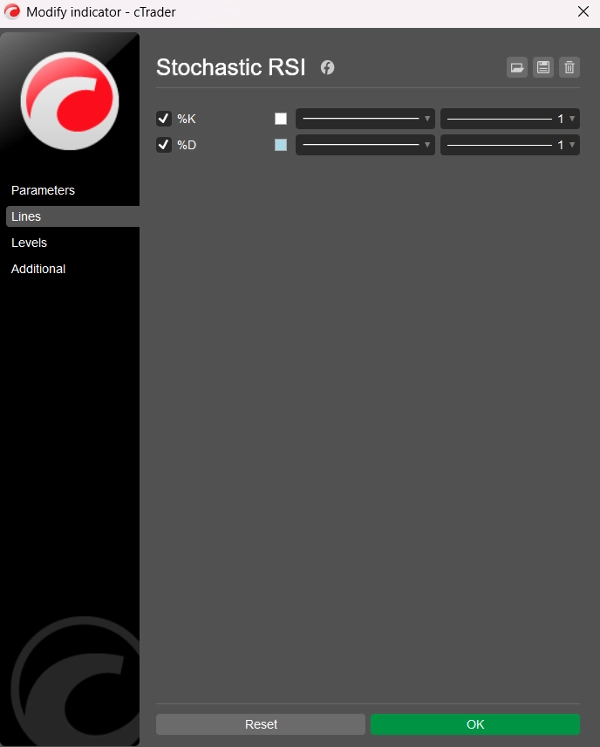
📊 Linie wyjściowe
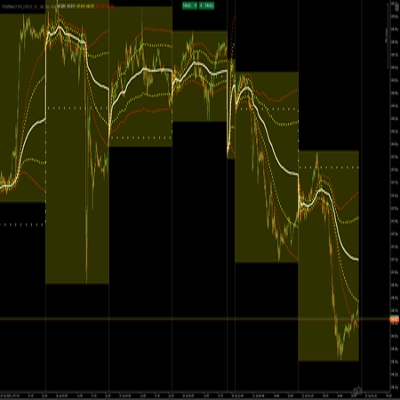
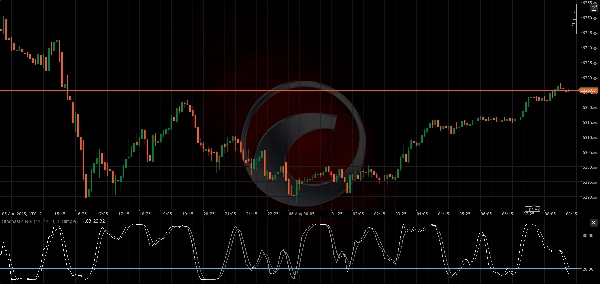
- Linia %K: Wygładzony Stochastic RSI (biały)
- Linia %D: Wygładzona średnia krocząca %K (jasnoniebieska)
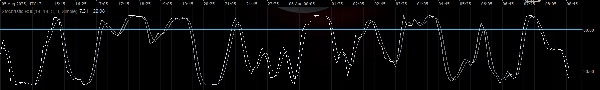
Obie linie oscylują między 0 a 100, co pozwala na wyraźne odczyty wykupienia i wyprzedania.
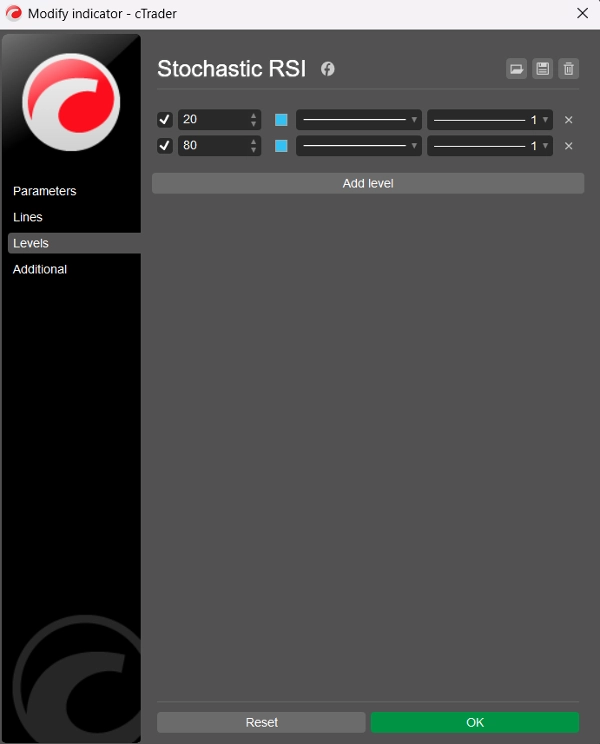
⚠️ Sugerowane poziomy
Chociaż wskaźnik domyślnie nie wyświetla statycznych poziomów, zaleca się użytkownikom dodanie ich ręcznie przez zakładkę „Poziomy” w cTrader:
- Poziom 80 → Wykupienie
- Poziom 20 → Wyprzedanie
Te poziomy działają podobnie do tradycyjnego oscylatora Stochastic, ale stosowane do zachowania RSI, co sprawia, że sygnały są ostrzejsze i często szybsze.
🧠 Jak używać
- Wykupienie (>80): Może wskazywać, że cena jest nadmiernie rozciągnięta w górę — potencjał do odwrócenia lub konsolidacji.
- Wyprzedanie (<20): Może sygnalizować, że cena jest wyprzedana — możliwy odbicie lub odwrócenie trendu.
- Przecięcia %K i %D: Mogą być używane podobnie jak Stochastic lub MACD — bycze przecięcie poniżej 20 lub niedźwiedzie przecięcie powyżej 80 może być sygnałem do działania.
🏷️ Uwagi
- Stworzony dla cTrader przy użyciu C# i Automate API
- Czysty, wydajny i konfigurowalny z 11 typami MA
- Kod i logika autorstwa BlueRocketBots & ChatGPT (OpenAI)
- Czysty kod (łącznie 99 linii; 54 linie kodu, 27 linii tekstu, 18 linii pustych)
- Wersja ulepszona V2
- Za darmo!
Podsumowanie
Key parameters include the RSI Period (default 14), Stochastic Period (default 14), %K and %D smoothing periods (default 3 each), and a choice among 11 moving average types for smoothing (default is Simple). The indicator outputs two lines: the %K line (smoothed Stochastic RSI) and the %D line (smoothed moving average of %K), both oscillating between 0 and 100.
Suggested manual levels for interpretation are 80 (overbought) and 20 (oversold). Traders may use these levels along with %K and %D crossovers to identify potential price reversals or consolidations. For example, a bullish crossover below 20 or a bearish crossover above 80 can signal actionable market moves.
The indicator is implemented in clean, efficient C# code using the Automate API, allowing customization and integration within cTrader.