
Descrição
Ultimate RSI (Índice de Força Relativa)
O Ultimate RSI é um oscilador avançado e personalizado projetado para fornecer uma leitura mais suave, limpa e responsiva do momentum do mercado e da força da tendência. Representa uma atualização significativa em relação ao Índice de Força Relativa (RSI) tradicional, focando em filtrar o ruído do mercado e minimizar sinais falsos (whipsaws). Isso o torna uma ferramenta inestimável para confirmar tendências e identificar pontos de reversão confiáveis.
Principais Características e Melhorias:
- Cálculo de Momentum Aumentado: O indicador utiliza um método sofisticado para calcular a variação de preço. Em vez de depender apenas dos movimentos diários de preço, o sinal de momentum é significativamente reforçado quando o preço registra uma nova máxima ou uma nova mínima dentro do período de análise. Esse processo garante que o indicador reaja de forma poderosa a rompimentos genuínos, ignorando movimentos menores e irregulares.
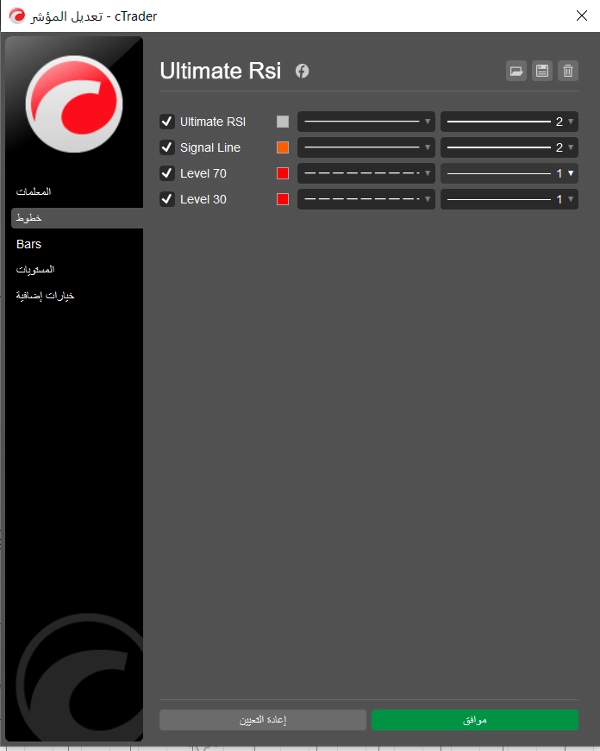
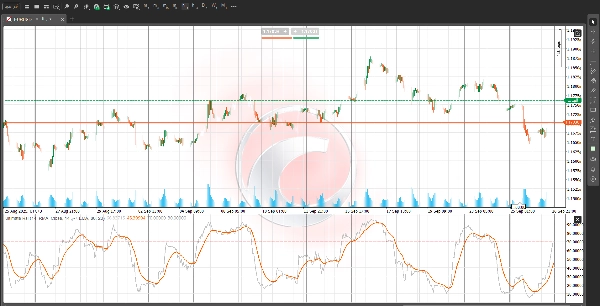
- Linha de Sinal Dedicada: Inclui uma Linha de Sinal distinta (uma média móvel do próprio RSI) que pode ser configurada independentemente. Os cruzamentos entre a linha do Ultimate RSI e sua Linha de Sinal são frequentemente usados como gatilhos mais claros e de maior confiança para entradas ou saídas, especialmente próximos aos níveis de sobrecompra/sobrevenda.
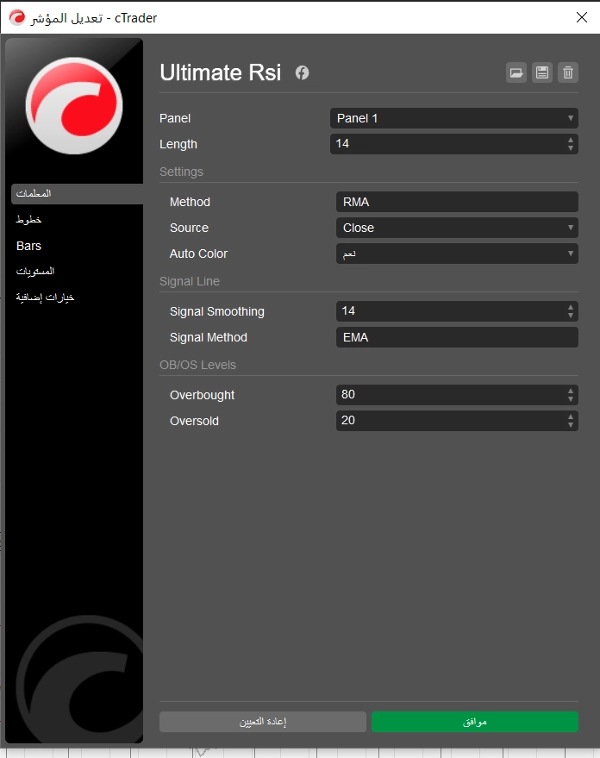
- Métodos Flexíveis de Suavização: Os usuários têm a flexibilidade de selecionar o tipo de suavização tanto para o cálculo do RSI quanto para a Linha de Sinal entre opções comuns: EMA (Média Móvel Exponencial), SMA (Média Móvel Simples), RMA (Média Móvel de Wilder) e TMA (Média Móvel Triangular). Isso permite uma personalização precisa da sensibilidade do indicador.
- Zonas Visuais OB/OS: O nível padrão de sobrecompra (OB) em 80 e o nível de sobrevenda (OS) em 20 são claramente marcados com sombreamento de fundo. Em mercados com forte tendência, leituras sustentadas dentro dessas zonas frequentemente indicam uma força de tendência excepcional em vez de uma reversão imediata, oferecendo uma ferramenta poderosa de confirmação para estratégias de seguimento de tendência.
Como Operar com o Ultimate RSI:
- Confirmação de Tendência: Use o nível 50 como centro de momentum. Uma leitura consistentemente acima de 50 confirma uma tendência de alta, enquanto uma leitura abaixo de 50 confirma uma tendência de baixa.
- Sinais de Entrada: Procure a linha do Ultimate RSI cruzar para cima da Linha de Sinal para uma possível entrada longa, e cruzar para baixo da Linha de Sinal para uma possível entrada curta, prestando atenção especial aonde esses cruzamentos ocorrem em relação ao nível 50.
- Redução de Ruído: Ao enfatizar a expansão verdadeira da faixa e utilizar suavização avançada, o Ultimate RSI ajuda os traders a manter o foco durante períodos de consolidação, prevenindo entradas ou saídas prematuras.
Aviso Legal: Esta descrição é apenas para fins informativos e educacionais. Operar envolve riscos, e todas as leituras do indicador devem ser combinadas com uma análise abrangente da ação do preço para quaisquer decisões de negociação.


