
SymbolTFOverlay
Wskaźnik
119 pobrania
Wersja 1.0, Sep 2025
Windows, Mac
Opis
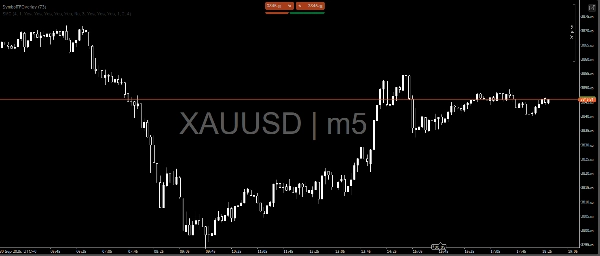
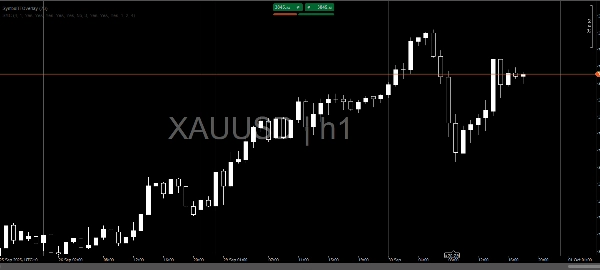
SymbolTFOverlay to niestandardowy wskaźnik dla platformy cTrader, zaprojektowany do wyświetlania aktualnego symbolu (np. EURUSD) i interwału czasowego (np. H1) jako półprzezroczystej nakładki tekstowej na wykresie. Ten wskaźnik poprawia czytelność wykresu, zapewniając wyraźny, centralny punkt odniesienia dla kluczowych informacji rynkowych.Kluczowe funkcje:
- Dynamiczne wyświetlanie tekstu: Pokazuje symbol i interwał czasowy (np. "EURUSD | H1") na środku widocznego obszaru wykresu.
- Automatyczne aktualizacje: Odświeża tekst za każdym razem, gdy powstaje nowy słupek, zapewniając, że pozostaje on wyśrodkowany.
- Dostosowywalny wygląd: Rozmiar czcionki, kolor i przezroczystość tekstu można dowolnie dostosować.
- Efektywne monitorowanie: Wykorzystuje timer (sprawdzający co 2 sekundy), aby wykrywać zmiany w widocznym obszarze wykresu, takie jak powiększanie lub przewijanie, dla płynnego przesuwania tekstu.
- Solidna walidacja: Zawiera kontrole zapobiegające błędom wynikającym z nieprawidłowych indeksów lub poziomów cen, zapewniając niezawodne działanie w różnych warunkach rynkowych.
- Projekt nakładki: Renderuje tekst bezpośrednio na wykresie, nie zaśmiecając go, utrzymując czysty wizualny odbiór.
Wskaźnik jest idealny dla traderów, którzy potrzebują szybkiego dostępu do informacji o symbolu i interwale czasowym podczas analizy wykresów, z automatycznymi dostosowaniami zapewniającymi optymalną widoczność podczas dynamicznych interakcji z wykresem.
Podsumowanie
Podsumowanie AI
SymbolTFOverlay is a custom indicator for the cTrader platform that displays the current trading symbol and timeframe as a semi-transparent text overlay centered on the chart. It dynamically updates the displayed text with each new bar formation to ensure accuracy. The indicator automatically repositions the overlay during chart interactions such as zooming or scrolling by checking the visible area every two seconds. Users can customize the font size, color, and transparency of the text to suit their preferences. Built-in validation prevents errors from invalid data, supporting reliable performance across various market conditions. The overlay design integrates the information directly on the chart without cluttering the visual space, enhancing chart readability. This indicator supports multiple market types including Forex, Indices, Commodities, Crypto, and Stocks. It is intended for traders who require immediate, clear reference to the current symbol and timeframe during technical analysis.
Profil wskaźnika
Opinie klientów
0.0
Opinie: 0
Opinie klientów
Ten produkt nie ma jeszcze opinii. Wypróbowałeś(-aś) go już? Bądź pierwszy(-a) i powiedz o tym innym!
Dyskusja
Częste pytania
Forex
Indices
Commodities
Crypto
Stocks
Produkty dostępne za pośrednictwem cTrader Store, w tym boty handlowe, wskaźniki i wtyczki, dostarczane są przez deweloperów zewnętrznych i udostępniane wyłącznie w celach informacyjnych oraz w celu zapewnienia dostępu technicznego. cTrader Store nie jest brokerem i nie zapewnia doradztwa inwestycyjnego, nie udziela spersonalizowanych rekomendacji ani nie gwarantuje przyszłych wyników.


Cena
Od 26/09/2025
119
Bezpłatne instalacje