Candle Pro
Indicador
121 transferências
Versão 1.0, Oct 2025
Windows, Mac
5.0
Avaliações: 1
Descrição
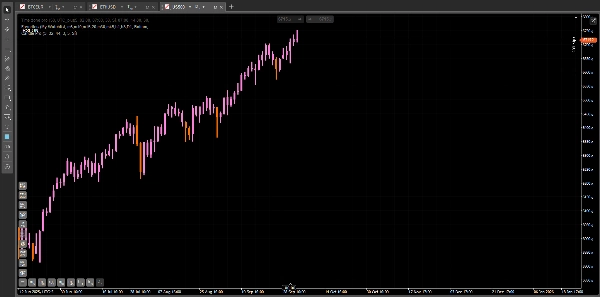
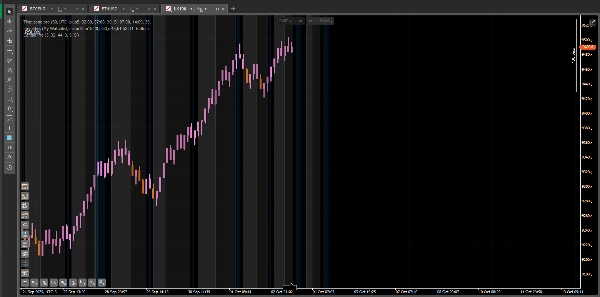
Candle Pro – Sinais visuais de RSI nas velas
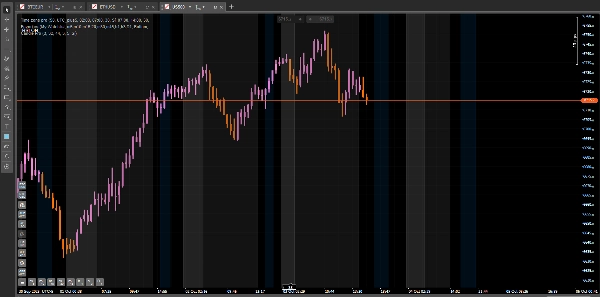
Candle Pro é um indicador que destaca velas diretamente no gráfico quando o RSI atinge níveis de sobrecompra ou sobrevenda, mantendo seu foco na ação do preço e evitando subgráficos extras.
🧭 Como usar
- Adicione o indicador ao seu gráfico.
- Ajuste os parâmetros do RSI para se adequar ao seu estilo de negociação.
- Observe como as velas mudam de cor em níveis extremos, marcando zonas potenciais de reversão ou momentum.
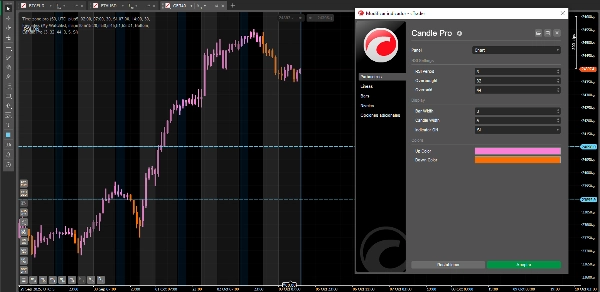
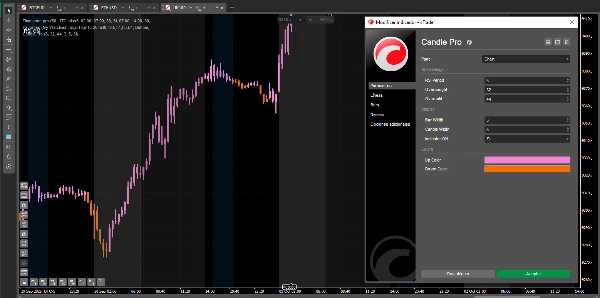
⚙️ Configurações sugeridas
Para uma resposta rápida e precisa:
- Período do RSI: 3
- Sobrecompra: 32
- Sobrevenda: 44
- Largura da vela: 3
- Largura da barra: 1
✨ Benefícios
- Sinais visuais limpos diretamente no preço.
- Funciona com qualquer símbolo e período de tempo.
- Cores e larguras de linha totalmente personalizáveis.
- Perfeito para scalping, intraday e swing trading.
Nota: Esta é a versão gratuita do Candle Pro. Uma versão premium está chegando em breve, repleta de recursos exclusivos para levar sua negociação ao próximo nível.
Resumo
Resumo de IA
Candle Pro is a trading indicator designed to visually highlight RSI (Relative Strength Index) signals directly on price candles, eliminating the need for separate RSI sub-charts. It marks candles on the chart when RSI reaches overbought or oversold levels, helping traders identify potential reversal or momentum zones. Users can customize RSI parameters, candle colors, and line widths to suit their trading style. The indicator supports any symbol and timeframe, making it suitable for scalping, intraday, and swing trading strategies. Suggested settings include an RSI period of 3, overbought level at 32, and oversold level at 44 for fast and precise signals. Candle Pro emphasizes clean visual cues integrated with price action to maintain chart clarity. This version is the free edition, with a premium version planned to offer additional features. Supported markets include Forex, Indices, and Crypto.
Perfil do indicador
Avaliações de clientes
5.0
Avaliações: 1
5 | 100 % | |
4 | 0 % | |
3 | 0 % | |
2 | 0 % | |
1 | 0 % |
Avaliações de clientes
November 3, 2025
This is an interesting indicator it really helps to filter out market noise. Thanks
Conversa
Perguntas frequentes
Forex
Indices
RSI
Crypto
Os produtos disponíveis através da cTrader Store, incluindo bots de negociação, indicadores e plugins, são fornecidos por programadores terceiros e são disponibilizados apenas para fins informativos e de acesso técnico. A cTrader Store não é um corretor e não fornece aconselhamento em matéria de investimento, recomendações pessoais ou qualquer garantia de desempenho no futuro.


Preço
Desde 24/02/2025
15
Vendas
1.84K
Instalações gratuitas