
Opis
📌 Trend Filtra Kalmana – Przegląd i Recenzja
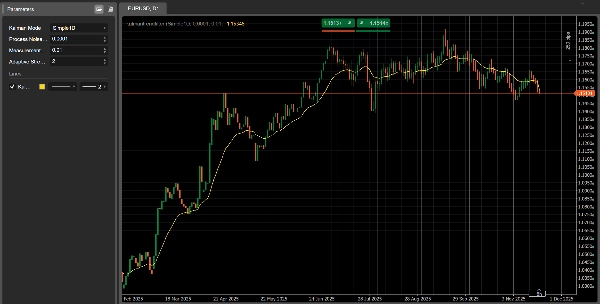
Trend Filtra Kalmana to zaawansowany wskaźnik podążający za trendem dla cTrader, zaprojektowany, aby dostarczyć gładką, wysoce responsywną linię trendu z znacznie mniejszym opóźnieniem niż tradycyjne średnie kroczące.
Gdzie klasyczne filtry SMA/EMA reagują powoli i często pomijają wczesne zmiany trendu, Filtr Kalmana:
- Ciągle aktualizuje swoje oszacowanie „prawdziwej” ceny
- Matematycznie równoważy gładkość i responsywność
- Dostosowuje się do zmienności (tryb adaptacyjny)
- Modeluje zarówno cenę, jak i prędkość (tryb 2D)
Czyni to potężnym narzędziem zarówno dla traderów manualnych, jak i twórców systemów automatycznych.
🎛 Tryby i Parametry
Tryb Kalmana (3 wersje w jednym wskaźniku)
1️⃣ Simple1D
Klasyczny jednowymiarowy filtr Kalmana.
Szybki, czysty i doskonały do wykrywania krótkoterminowych trendów.
2️⃣ PositionVelocity2D
Modeluje zarówno cenę, jak i prędkość trendu.
Idealny jako filtr kierunkowy w strategiach algorytmicznych.
3️⃣ Adaptive1D
Automatycznie dostosowuje się do zmienności.
Bardziej reaktywny na szybkim rynku, gładszy w spokojnych warunkach.
🧩 Kluczowe Parametry Wyjaśnione
- Szum Procesu (Q):
Wyższy = szybsza reakcja na trend, niższy = gładsza linia. - Szum Pomiaru (R):
Wyższy = filtr mniej ufa danym → gładszy wynik. - Siła Adaptacji:
Stosowana tylko w Adaptive1D. Kontroluje, jak silnie zmienność wpływa na filtr.
📈 Jak Interpretować Sygnały
1. Wykrywanie Kierunku Trendu
- Trend wzrostowy: Linia nachylona w górę, cena utrzymuje się powyżej filtra.
- Trend spadkowy: Linia nachylona w dół, cena utrzymuje się poniżej filtra.
- Boczny: Rynek konsoliduje się, unikaj strategii wybicia.
2. Sygnały Wejścia (logika przecięcia)
Wejście bycze:
- Cena zamyka się powyżej linii Kalmana
- Linia zaczyna się obracać w górę
Wejście niedźwiedzie:
- Cena zamyka się poniżej linii Kalmana
- Linia zaczyna się obracać w dół
3. Siła Trendu (tryb 2D)
Nachylenie staje się bezpośrednim odczytem momentum:
- Silne nachylenie w górę → silny trend wzrostowy
- Silne nachylenie w dół → silny trend spadkowy
- Wyrównujące się nachylenie → osłabienie trendu lub faza przejściowa
📊 Praktyczne Przykłady Zastosowania
✔ Strategia podążania za trendem
Użyj Simple1D lub Adaptive1D:
- Kupuj powyżej linii, gdy nachylenie staje się dodatnie
- Sprzedawaj poniżej linii, gdy nachylenie staje się ujemne
✔ Podejście wieloczasowe
- Użyj Kalmana na H1 do określenia kierunku
- Użyj Kalmana na M15 do precyzyjnych wejść
- Wchodź tylko w kierunku wskazanym przez wyższy interwał czasowy
✔ Integracja z botem
Idealny do handlu algorytmicznego:
- Pozwól na tylko pozycje długie jeśli nachylenie > 0
- Pozwól na tylko pozycje krótkie jeśli nachylenie < 0
- Użyj Adaptive1D dla zmiennych indeksów takich jak US500, NAS100, US2000
🌟 Dołącz do naszej społeczności
Jeśli chcesz mieć dostęp do:
- Ekskluzywnych optymalizacji dla każdego z naszych botów
- Zaawansowanych wskazówek konfiguracyjnych
- Ulepszeń w handlu
- Spersonalizowanej pomocy technicznej
- Aktualizacji i nowych narzędzi
👉 Dołącz do naszej społeczności, klikając link na mojej stronie profilowej.
Tam znajdziesz najlepsze ustawienia optymalizacji dla wszystkich naszych botów, regularnie aktualizowane.
Podsumowanie
Opinie klientów
5 | 0 % | |
4 | 100 % | |
3 | 0 % | |
2 | 0 % | |
1 | 0 % |


![Logo „[CB] Pivot Points Pro”](https://cdn.ctrader.com/image/webp/43463c82-67b0-4f10-a4ba-901bba091d81_32594)


![Logo „Smart Money Concepts (SMC) [Iridio Capital]”](https://cdn.ctrader.com/image/webp/28b69fd1-ef54-4bed-9487-07e78e883be4_40934)


