Donchian Flux Cloud_withSourceCode
Wskaźnik
Wersja 1.0, Nov 2025
Windows, Mac
Opis
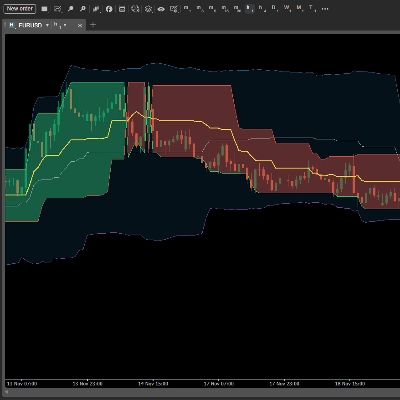
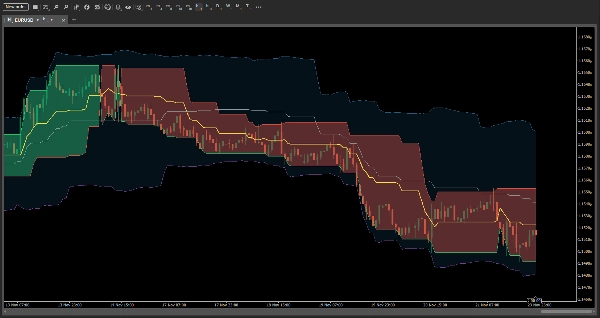
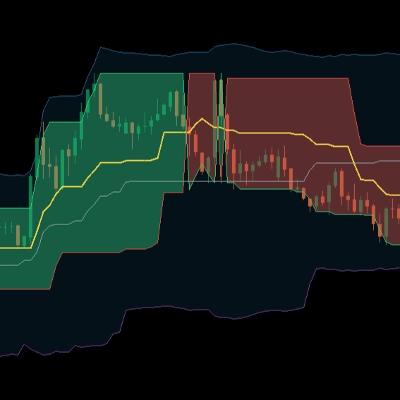
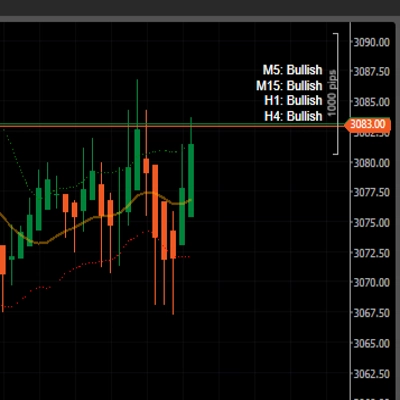
Donchian Flux Cloud to wizualizator trendu i zmienności zbudowany z dwóch kanałów Donchiana (szybki i wolny) oraz zewnętrznej otoczki opartej na ATR.
Wewnętrzna chmura śledzi szybki zakres Donchiana i zmienia kolor zgodnie z dominującym trendem, podczas gdy zewnętrzny pas rozszerza się i kurczy wraz z ATR, aby pokazać, kiedy cena przebija się do obszaru wyższej zmienności. Został zaprojektowany, aby na pierwszy rzut oka wyróżniać ściskania, wybicia i zmiany reżimu bez zaśmiecania wykresu.
Podsumowanie
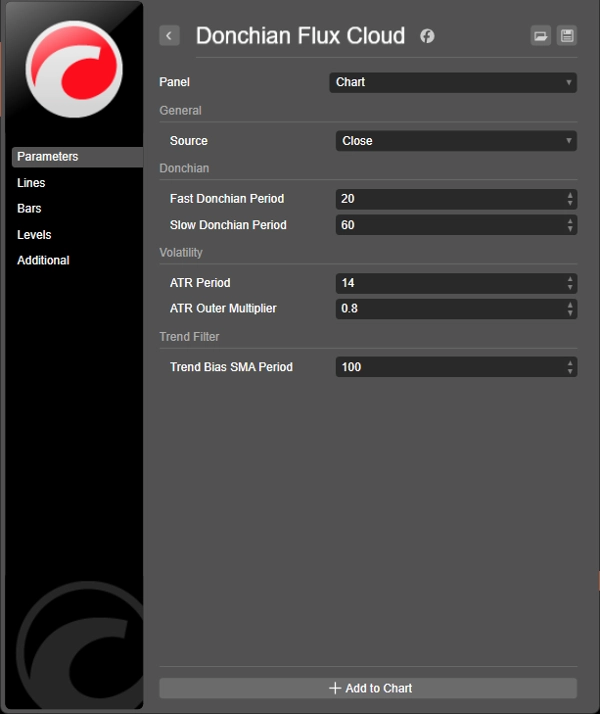
Profil wskaźnika
Opinie klientów
0.0
Opinie: 0
Opinie klientów
Ten produkt nie ma jeszcze opinii. Wypróbowałeś(-aś) go już? Bądź pierwszy(-a) i powiedz o tym innym!
Dyskusja
Częste pytania
ATR
Produkty dostępne za pośrednictwem cTrader Store, w tym boty handlowe, wskaźniki i wtyczki, dostarczane są przez deweloperów zewnętrznych i udostępniane wyłącznie w celach informacyjnych oraz w celu zapewnienia dostępu technicznego. cTrader Store nie jest brokerem i nie zapewnia doradztwa inwestycyjnego, nie udziela spersonalizowanych rekomendacji ani nie gwarantuje przyszłych wyników.
Więcej od tego autora


![Logo „Gaussian Channel [Iridio Capital]”](https://cdn.ctrader.com/image/webp/7c039209-5573-4a54-a072-f9528b503103_41960)

Cena
164
Bezpłatne instalacje