Deskripsi
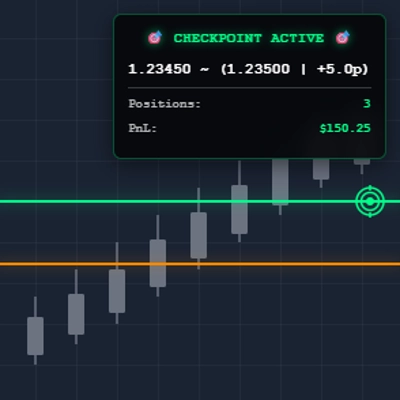
Indikator Checkpoint
Kalkulator harga rata-rata pintar untuk manajemen multi-posisi. Menampilkan level impas secara real-time dengan umpan balik visual dinamis. Sempurna untuk trader yang mengelola beberapa entri di berbagai instrumen.
Fitur Utama:
- Perhitungan rata-rata tertimbang secara real-time
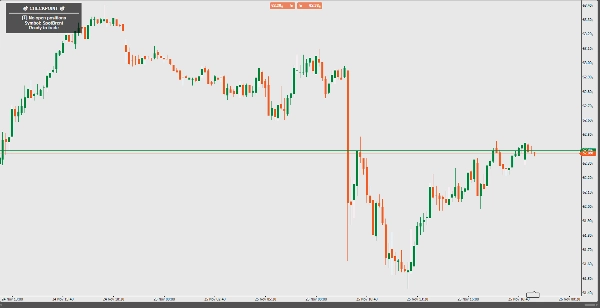
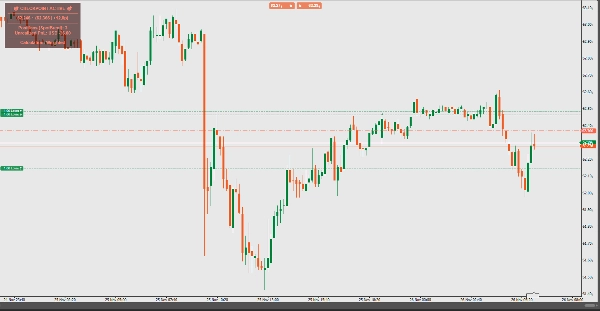
- Tampilan garis cerdas (hanya muncul dengan 2+ posisi)
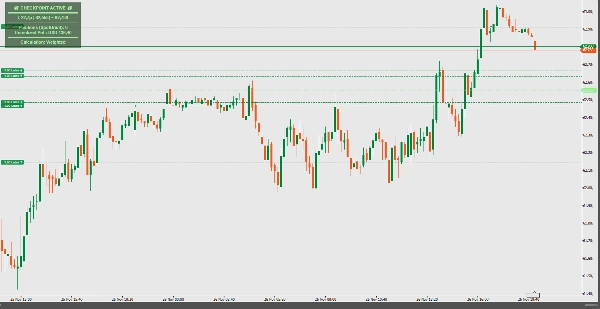
- Pewarnaan dinamis berbasis PnL (hijau/merah/putih)
- Indikator kekuatan dalam pips dari harga saat ini
- Panel info yang bersih dan profesional
- Performa tanpa lag
Cara Kerja:
Secara otomatis menghitung harga rata-rata posisi Anda menggunakan metode rata-rata sederhana atau berbasis volume tertimbang. Indikator menampilkan garis horizontal yang jelas menandai titik impas Anda ketika Anda memiliki beberapa posisi, membantu Anda membuat keputusan trading yang tepat berdasarkan kesehatan posisi keseluruhan Anda.
Sempurna Untuk:
- Trader posisi yang melakukan scaling in/out
- Manajemen portofolio di berbagai instrumen
- Manajemen risiko dan penempatan stop-loss
- Visualisasi titik saldo akun trading Anda
Cukup terapkan pada grafik apa saja dan biarkan Checkpoint mengurus sisanya - checkpoint trading Anda menjadi sederhana!
Ringkasan
Profil indikator
Ulasan pelanggan
0.0
Ulasan: 0
Ulasan pelanggan
Belum ada ulasan untuk produk ini. Sudah mencobanya? Jadilah pemberi ulasan pertama!
Diskusi
Pertanyaan umum
BTCUSD
Forex
Indices
EURUSD
Commodities
GBPUSD
NZDUSD
Crypto
Stocks
XAUUSD
NAS100
USDJPY
Produk-produk yang tersedia melalui cTrader Store, termasuk bot trading, indikator, dan plugin, disediakan oleh pengembang pihak ketiga serta hanya ditujukan untuk akses teknis dan informasi. cTrader Store bukan broker dan tidak menyediakan saran investasi, rekomendasi pribadi, atau jaminan apa pun tentang kinerja di masa mendatang.
Produk lain dari penulis ini


Harga
Sejak 28/12/2024
54
Instal gratis