Opis
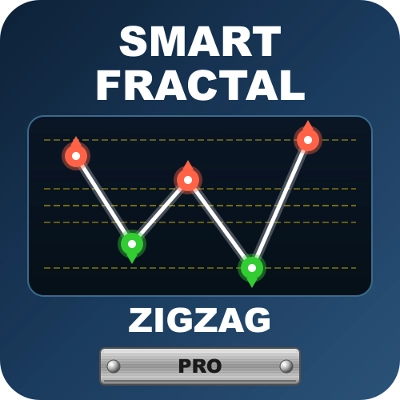
SmartFractalZigZag Pro — Inteligentne fraktale, ZigZag i automatyczne Fibonacciego
════════════════════════════════════════════════════════════════════════════════
PRZEGLĄD PRODUKTU
SmartFractalZigZag Pro to kompletne narzędzie do analizy struktury rynku i Fibonacciego dla cTrader.
Łączy stabilny w historii silnik fraktalny, czyste oscylacje ZigZag oraz w pełni automatyczne poziomy Fibonacciego (zniesienia/rozszerzenia) w jednym wskaźniku. Wszystkie poziomy są zakotwiczone wyłącznie do strukturalnie ważnych lokalnych maksimów i minimów, dzięki czemu pracujesz z prawdziwymi ekstremami, a nie szumem wewnątrzsłupkowym.
════════════════════════════════════════════════════════════════════════════════
PORÓWNANIE FUNKCJI (Pro vs Plus)
Zarówno Pro, jak i Plus zawierają:
• Inteligentne wykrywanie fraktali i filtrowanie w tym samym kierunku
• Połączenia oscylacji ZigZag
• Automatyczne Fibonacciego w czasie rzeczywistym
Funkcje dostępne tylko w Plus:
• Dynamiczne strefy wsparcia/oporu (mapa gęstości KDE)
• Zbieżność wsparcia/oporu na wyższych interwałach czasowych
• Trend Bias wsparcia/oporu (indeks byka/niedźwiedzia + panel)
════════════════════════════════════════════════════════════════════════════════
KLUCZOWE FUNKCJE
────────────────────────────────────────────────────────────────────────────────
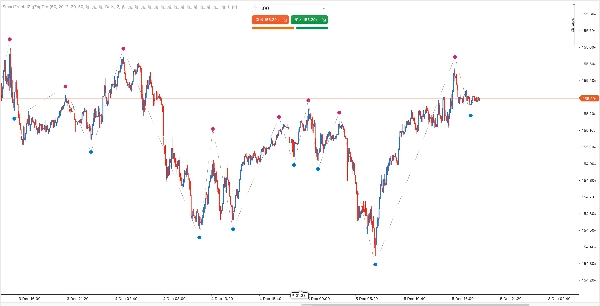
1. INTELIGENTNE WYKRYWANIE FRAKTALI
Fraktale są podstawą analizy struktury rynku — identyfikują lokalne ekstremalne ceny (lokalne maksima i minima).
SmartFractalZigZag wykorzystuje stabilny w historii silnik fraktalny z regulowaną czułością, dzięki czemu możesz dostosować wykrywanie do skalpowania, handlu intraday, swingowego lub pozycyjnego. Parametry Left Bars i Right Bars pozwalają uczynić silnik bardziej lub mniej selektywnym bez zmiany ogólnej logiki strategii.
Zalecane ustawienia według stylu handlu:
• Skalpowanie: Left 3 / Right 2
• Intraday: Left 5 / Right 3
• Swing: Left 10 / Right 5
• Pozycja: Left 20 / Right 10
────────────────────────────────────────────────────────────────────────────────
2. INTELIGENTNE FILTROWANIE W TYM SAMYM KIERUNKU
Gdy pojawia się kilka kolejnych fraktali w tym samym kierunku, wskaźnik zachowuje tylko prawdziwe ekstremum (najwyższe maksimum dla fraktali wzrostowych, najniższe minimum dla fraktali spadkowych).
Zapewnia to czystą sekwencję Maksimum–Minimum–Maksimum–Minimum i ułatwia czytanie struktury.
────────────────────────────────────────────────────────────────────────────────
3. OSCYLACJE ZIGZAG
Łączy przefiltrowane punkty fraktalne w oscylacje, wyraźnie pokazując kierunek trendu i granice oscylacji na pierwszy rzut oka.
────────────────────────────────────────────────────────────────────────────────
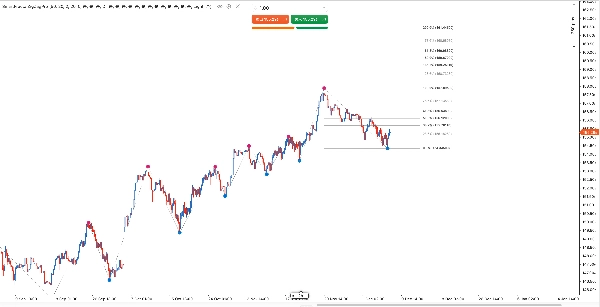
4. AUTOMATYCZNE FIBONACCIE W CZASIE RZECZYWISTYM
Automatycznie rysuje poziomy zniesień i rozszerzeń Fibonacciego na podstawie najnowszej oscylacji:
• Automatyczne kotwice – zawsze połączone z potwierdzonymi strukturalnymi maksimami/minimami
• Dynamiczne aktualizacje – poziomy dostosowują się w czasie rzeczywistym wraz z powstawaniem nowej struktury
• Pełny zestaw powszechnie używanych poziomów zniesień i rozszerzeń (w tym ujemne rozszerzenia dla kontynuacji trendu), wszystkie indywidualnie konfigurowalne
────────────────────────────────────────────────────────────────────────────────
5. WSPARCIE MOTYWÓW
Wbudowane wsparcie motywów jasnych/ciemnych, które automatycznie dopasowuje się do tła wykresu.
════════════════════════════════════════════════════════════════════════════════
DLA KOGO JEST TEN PRODUKT?
• Traderzy intraday i swingowi, którzy chcą czystej, historycznie spójnej struktury i precyzyjnych kotwic Fibonacciego
• Traderzy SMC/ICT, którzy polegają na strefach OTE i zbieżności struktury
• Traderzy dyskrecjonalni, którzy mają dość ręcznego rysowania poziomów Fibonacciego
════════════════════════════════════════════════════════════════════════════════
DLACZEGO SMARTFRACTALZIGZAG PRO?
Problem: Ręczne rysowanie Fibonacciego jest powolne i podatne na błędy
Rozwiązanie: Automatycznie wykrywa oscylacje i aktualizuje poziomy Fibonacciego na bieżąco
Problem: Przemalowujące się fraktale zniekształcają sygnał
Rozwiązanie: Brak logiki patrzącej w przyszłość – wszystkie fraktale są potwierdzane tylko na zamkniętych słupkach
Problem: Zbyt wiele oddzielnych narzędzi zaśmieca wykres
Rozwiązanie: Jeden wskaźnik łączy fraktale + ZigZag + Fibonacciego
Problem: Kotwice wybierane „na oko” są niespójne
Rozwiązanie: Ścisły silnik fraktalny zapewnia, że kotwice to matematycznie precyzyjne maksima/minima
════════════════════════════════════════════════════════════════════════════════
DZIAŁA Z KAŻDĄ METODOLOGIĄ
• SMC / ICT – BOS, CHoCH, punkty oscylacji, strefy OTE
• Fale Elliotta – punkty zwrotne oscylacji i rozszerzenia Fibonacciego
• Teoria Dowa – wyższe maksima / niższe minima
• Wyckoff – strefy podaży/popytu, sprężyny
• Teoria Chana – pióra i segmenty
• Fibonacci – automatycznie rysowane poziomy, bez ręcznej pracy
════════════════════════════════════════════════════════════════════════════════
PARAMETRY
────────────────────────────────────────────────────────────────────────────────
1. Ustawienia fraktali
• Left Bars – Słupki po lewej do porównania (domyślnie: 20)
• Right Bars – Słupki po prawej do potwierdzenia (domyślnie: 2)
Wyświetlanie fraktali:
• Kolor fraktala wzrostowego – domyślnie: DeepPink
• Kolor fraktala spadkowego – domyślnie: DodgerBlue
• Rozmiar fraktala – domyślnie: 20
• Przesunięcie fraktala (punkty) – domyślnie: 50
• Pokaż fraktale – domyślnie: WŁ.
Ustawienia filtra:
• Filter Consecutive – Inteligentne filtrowanie w tym samym kierunku, warunek wstępny dla ZigZag i Fibonacciego (domyślnie: WŁ.)
────────────────────────────────────────────────────────────────────────────────
2. Ustawienia ZigZag
• Włącz ZigZag – domyślnie: WŁ.
• Kolor ZigZag – domyślnie: Szary
• Styl ZigZag – domyślnie: Kropki
• Grubość ZigZag – domyślnie: 2
────────────────────────────────────────────────────────────────────────────────
3. Ustawienia Fibonacciego
• Włącz Fibonacciego – główny przełącznik (domyślnie: WŁ.)
• Pokaż etykiety – pokaż etykiety cenowe (domyślnie: WŁ.)
• Przełączniki poziomów – 19 indywidualnych przełączników dla poziomów od -100% do 200% (poziomy podstawowe domyślnie WŁ.)
────────────────────────────────────────────────────────────────────────────────
4. Ustawienia wyświetlania i motywu
• Prawe przesunięcie – liczba słupków zarezerwowana po prawej stronie (domyślnie: 10)
• Motyw kolorystyczny – jasny / ciemny (domyślnie: jasny)
────────────────────────────────────────────────────────────────────────────────
5. Inne ustawienia
• Wymuś czyszczenie wszystkich instancji – domyślnie: WYŁ.
════════════════════════════════════════════════════════════════════════════════
AKTUALIZACJA DO PLUS
Jeśli potrzebujesz również:
• Dynamiczne strefy wsparcia/oporu oparte na klasteryzacji gęstości fraktali i algorytmie KDE
• Automatyczną zbieżność wsparcia/oporu na wielu interwałach czasowych, która podkreśla, gdy strefy z wyższych interwałów wspierają aktualny wykres
• Trend Bias wsparcia/oporu (indeks siły byków/niedźwiedzi + panel), który agreguje siłę pobliskiego wsparcia i oporu w jeden, łatwy do odczytania wskaźnik
rozważ aktualizację do SmartFractalZigZag Plus — rozszerza ten sam silnik bazowy o pełny workflow struktury + matematyki + dynamicznego wsparcia/oporu + zbieżności HTF.
════════════════════════════════════════════════════════════════════════════════
WAŻNE UWAGI
ZACHOWANIE OSCYLACJI (Stabilna historia z założenia)
Wskaźnik jest zaprojektowany tak, aby potwierdzone oscylacje pozostawały stabilne w historii, jednocześnie pozwalając aktywnej nodze reagować na nową akcję cenową. Gdy oscylacja jest strukturalnie potwierdzona, jej punkty kotwiczące są zablokowane; tylko wciąż formująca się noga może się dostosowywać w miarę rozwoju rynku.
ZALEŻNOŚCI PRZEŁĄCZNIKÓW
Zarówno ZigZag, jak i Fibonacci wymagają włączenia Filter Consecutive. Jeśli wyłączysz tę opcję, wyświetlane będą tylko surowe punkty fraktalne, a ZigZag/Fibonacci zostaną wyłączone.
WERSJA TESTOWA
Dostępna jest 7-dniowa wersja próbna w sklepie cTrader, dzięki czemu możesz przetestować wskaźnik na własnych symbolach i interwałach przed zakupem.
════════════════════════════════════════════════════════════════════════════════
WSPARCIE
Jeśli masz pytania lub uwagi, skontaktuj się z nami przez sklep cTrader.
Dziękujemy za wybór SmartFractalZigZag Pro!
Podsumowanie
Opinie klientów
5 | 100 % | |
4 | 0 % | |
3 | 0 % | |
2 | 0 % | |
1 | 0 % |